

1. North-South Variations in West Coast Hydrometeorological Parameters 13
for the precipitation maximum. The ITCZ is a band of ascending air that
migrates with season and is characterized by deep convection, which
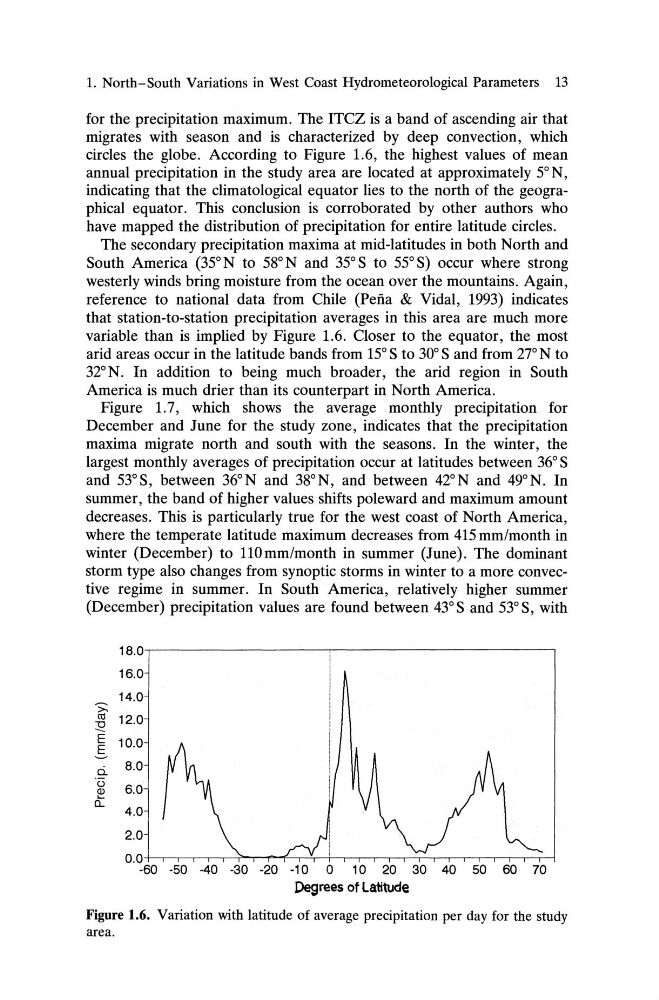
circles the globe. According to Figure 1.6, the highest values of mean
annual precipitation in the study area are located at approximately 5°N,
indicating that the climatological equator lies to the north of the geographical equator. This conclusion is corroborated by other authors who
have mapped the distribution of precipitation for entire latitude circles.
The secondary precipitation maxima at mid-latitudes in both North and
South America (35°N to 58°Nand 35°S to 55°S) occur where strong
westerly winds bring moisture from the ocean over the mountains. Again,
reference to national data from Chile (Pefia & Vidal, 1993) indicates
that station-to-station precipitation averages in this area are much more
variable than is implied by Figure 1.6. Closer to the equator, the most
arid areas occur in the latitude bands from 15°S to 30°S and from 27°N to
32°N. In addition to being much broader, the arid region in South
America is much drier than its counterpart in North America.
Figure 1.7, which shows the average monthly precipitation for
December and June for the study zone, indicates that the precipitation
maxima migrate north and south with the seasons. In the winter, the
largest monthly averages of precipitation occur at latitudes between 36°S
and 53°S, between 36°Nand 38°N, and between 42°Nand 49°N. In
summer, the band of higher values shifts poleward and maximum amount
decreases. This is particularly true for the west coast of North America,
where the temperate latitude maximum decreases from 415mm/month in
winter (December) to 11Omm/month in summer (June). The dominant
storm type also changes from synoptic storms in winter to a more convective regime in summer. In South America, relatively higher summer
(December) precipitation values are found between 43°Sand 53°S, with
18 .0
16.0
14.0
~
co 12.0
"0
-- E 10 .0
S
d,
8.0
o
6.0
~
o,
4 .0
2.0
0.0
-60 ·50 -40 -30 -20 -10 0 10 20 30 40 50 60 70
Degrees of Latitude
Figure 1.6. Variation with latitude of average precipitation per day for the study
area.
for the precipitation maximum. The ITCZ is a band of ascending air that
migrates with season and is characterized by deep convection, which
circles the globe. According to Figure 1.6, the highest values of mean
annual precipitation in the study area are located at approximately 5°N,
indicating that the climatological equator lies to the north of the geographical equator. This conclusion is corroborated by other authors who
have mapped the distribution of precipitation for entire latitude circles.
The secondary precipitation maxima at mid-latitudes in both North and
South America (35°N to 58°Nand 35°S to 55°S) occur where strong
westerly winds bring moisture from the ocean over the mountains. Again,
reference to national data from Chile (Pefia & Vidal, 1993) indicates
that station-to-station precipitation averages in this area are much more
variable than is implied by Figure 1.6. Closer to the equator, the most
arid areas occur in the latitude bands from 15°S to 30°S and from 27°N to
32°N. In addition to being much broader, the arid region in South
America is much drier than its counterpart in North America.
Figure 1.7, which shows the average monthly precipitation for
December and June for the study zone, indicates that the precipitation
maxima migrate north and south with the seasons. In the winter, the
largest monthly averages of precipitation occur at latitudes between 36°S
and 53°S, between 36°Nand 38°N, and between 42°Nand 49°N. In
summer, the band of higher values shifts poleward and maximum amount
decreases. This is particularly true for the west coast of North America,
where the temperate latitude maximum decreases from 415mm/month in
winter (December) to 11Omm/month in summer (June). The dominant
storm type also changes from synoptic storms in winter to a more convective regime in summer. In South America, relatively higher summer
(December) precipitation values are found between 43°Sand 53°S, with
18 .0
16.0
14.0
~
co 12.0
"0
-- E 10 .0
S
d,
8.0
o
6.0
~
o,
4 .0
2.0
0.0
-60 ·50 -40 -30 -20 -10 0 10 20 30 40 50 60 70
Degrees of Latitude
Figure 1.6. Variation with latitude of average precipitation per day for the study
area.