

261
were in good agreement with observed values, and it was confirmed that the annual
variations of eelgrass biomass can be reproduced by the model.
9.4.2 Mass Balance in Eelgrass Beds
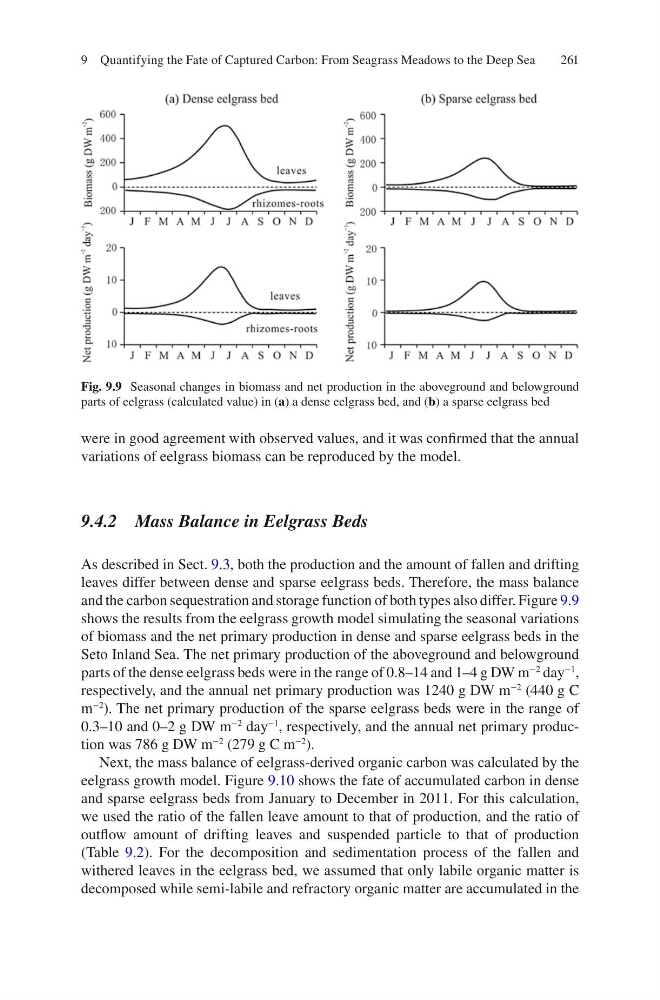
As described in Sect. 9.3, both the production and the amount of fallen and drifting
leaves differ between dense and sparse eelgrass beds. Therefore, the mass balance
and the carbon sequestration and storage function of both types also differ. Figure 9.9
shows the results from the eelgrass growth model simulating the seasonal variations
of biomass and the net primary production in dense and sparse eelgrass beds in the
Seto Inland Sea. The net primary production of the aboveground and belowground
parts of the dense eelgrass beds were in the range of 0.8–14 and 1–4 g DW m
−2
day
−1
,
respectively, and the annual net primary production was 1240 g DW m
−2
(440 g C
m
−2
). The net primary production of the sparse eelgrass beds were in the range of
0.3–10 and 0–2 g DW m
−2
day
−1
, respectively, and the annual net primary production was 786 g DW m
−2
(279 g C m
−2
).
Next, the mass balance of eelgrass-derived organic carbon was calculated by the
eelgrass growth model. Figure 9.10 shows the fate of accumulated carbon in dense
and sparse eelgrass beds from January to December in 2011. For this calculation,
we used the ratio of the fallen leave amount to that of production, and the ratio of
outflow amount of drifting leaves and suspended particle to that of production
(Table 9.2). For the decomposition and sedimentation process of the fallen and
withered leaves in the eelgrass bed, we assumed that only labile organic matter is
decomposed while semi-labile and refractory organic matter are accumulated in the
Fig. 9.9 Seasonal changes in biomass and net production in the aboveground and belowground
parts of eelgrass (calculated value) in (a) a dense eelgrass bed, and (b) a sparse eelgrass bed
9 Quantifying the Fate of Captured Carbon: From Seagrass Meadows to the Deep Sea
were in good agreement with observed values, and it was confirmed that the annual
variations of eelgrass biomass can be reproduced by the model.
9.4.2 Mass Balance in Eelgrass Beds
As described in Sect. 9.3, both the production and the amount of fallen and drifting
leaves differ between dense and sparse eelgrass beds. Therefore, the mass balance
and the carbon sequestration and storage function of both types also differ. Figure 9.9
shows the results from the eelgrass growth model simulating the seasonal variations
of biomass and the net primary production in dense and sparse eelgrass beds in the
Seto Inland Sea. The net primary production of the aboveground and belowground
parts of the dense eelgrass beds were in the range of 0.8–14 and 1–4 g DW m
−2
day
−1
,
respectively, and the annual net primary production was 1240 g DW m
−2
(440 g C
m
−2
). The net primary production of the sparse eelgrass beds were in the range of
0.3–10 and 0–2 g DW m
−2
day
−1
, respectively, and the annual net primary production was 786 g DW m
−2
(279 g C m
−2
).
Next, the mass balance of eelgrass-derived organic carbon was calculated by the
eelgrass growth model. Figure 9.10 shows the fate of accumulated carbon in dense
and sparse eelgrass beds from January to December in 2011. For this calculation,
we used the ratio of the fallen leave amount to that of production, and the ratio of
outflow amount of drifting leaves and suspended particle to that of production
(Table 9.2). For the decomposition and sedimentation process of the fallen and
withered leaves in the eelgrass bed, we assumed that only labile organic matter is
decomposed while semi-labile and refractory organic matter are accumulated in the
Fig. 9.9 Seasonal changes in biomass and net production in the aboveground and belowground
parts of eelgrass (calculated value) in (a) a dense eelgrass bed, and (b) a sparse eelgrass bed
9 Quantifying the Fate of Captured Carbon: From Seagrass Meadows to the Deep Sea