

262
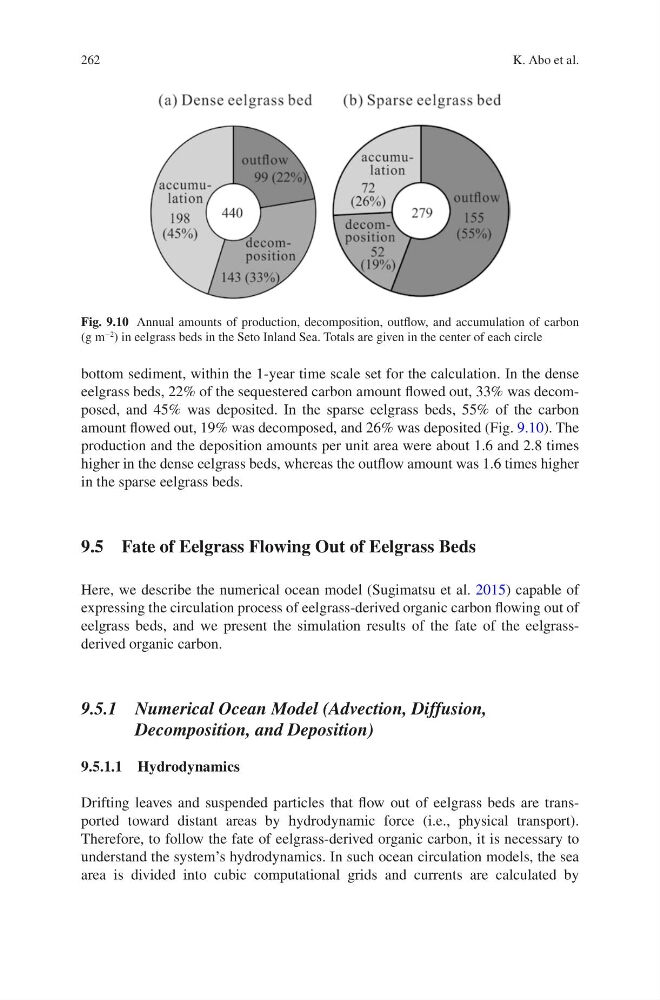
bottom sediment, within the 1-year time scale set for the calculation. In the dense
eelgrass beds, 22% of the sequestered carbon amount flowed out, 33% was decomposed, and 45% was deposited. In the sparse eelgrass beds, 55% of the carbon
amount flowed out, 19% was decomposed, and 26% was deposited (Fig. 9.10). The
production and the deposition amounts per unit area were about 1.6 and 2.8 times
higher in the dense eelgrass beds, whereas the outflow amount was 1.6 times higher
in the sparse eelgrass beds.
9.5 Fate of Eelgrass Flowing Out of Eelgrass Beds
Here, we describe the numerical ocean model (Sugimatsu et al. 2015) capable of
expressing the circulation process of eelgrass-derived organic carbon flowing out of
eelgrass beds, and we present the simulation results of the fate of the eelgrassderived organic carbon.
9.5.1 Numerical Ocean Model (Advection, Diffusion,
Decomposition, and Deposition)
9.5.1.1 Hydrodynamics
Drifting leaves and suspended particles that flow out of eelgrass beds are transported toward distant areas by hydrodynamic force (i.e., physical transport).
Therefore, to follow the fate of eelgrass-derived organic carbon, it is necessary to
understand the system’s hydrodynamics. In such ocean circulation models, the sea
area is divided into cubic computational grids and currents are calculated by
Fig. 9.10 Annual amounts of production, decomposition, outflow, and accumulation of carbon
(g m
−2 ) in eelgrass beds in the Seto Inland Sea. Totals are given in the center of each circle
K. Abo et al.
bottom sediment, within the 1-year time scale set for the calculation. In the dense
eelgrass beds, 22% of the sequestered carbon amount flowed out, 33% was decomposed, and 45% was deposited. In the sparse eelgrass beds, 55% of the carbon
amount flowed out, 19% was decomposed, and 26% was deposited (Fig. 9.10). The
production and the deposition amounts per unit area were about 1.6 and 2.8 times
higher in the dense eelgrass beds, whereas the outflow amount was 1.6 times higher
in the sparse eelgrass beds.
9.5 Fate of Eelgrass Flowing Out of Eelgrass Beds
Here, we describe the numerical ocean model (Sugimatsu et al. 2015) capable of
expressing the circulation process of eelgrass-derived organic carbon flowing out of
eelgrass beds, and we present the simulation results of the fate of the eelgrassderived organic carbon.
9.5.1 Numerical Ocean Model (Advection, Diffusion,
Decomposition, and Deposition)
9.5.1.1 Hydrodynamics
Drifting leaves and suspended particles that flow out of eelgrass beds are transported toward distant areas by hydrodynamic force (i.e., physical transport).
Therefore, to follow the fate of eelgrass-derived organic carbon, it is necessary to
understand the system’s hydrodynamics. In such ocean circulation models, the sea
area is divided into cubic computational grids and currents are calculated by
Fig. 9.10 Annual amounts of production, decomposition, outflow, and accumulation of carbon
(g m
−2 ) in eelgrass beds in the Seto Inland Sea. Totals are given in the center of each circle
K. Abo et al.