

242
sunlight. In winter, the CO 2 flux ranged from −2.39 to 0.62 mg CO 2 /m
2
/min and
averaged −0.23 mg CO 2 /m
2
/min, making the area a CO 2 sink.
CO 2 was absorbed during daytime at all times of year except during spring mornings, indicating that daytime CO 2 absorption by microalgal photosynthesis usually
exceeded CO 2 emission by decomposition of organic matter or respiration. Our estimates of total CO 2 budgets also showed that the intertidal area mainly acted as a
CO 2 sink except in spring. During the warmer seasons, CO 2 emissions at night
increased as did CO 2 absorption during the daytime, the result being that on a net
basis CO 2 was absorbed. In winter, biological activities were weaker as inferred
from the low CO 2 emissions at night, thus on a net basis CO 2 was absorbed during
the cold season.
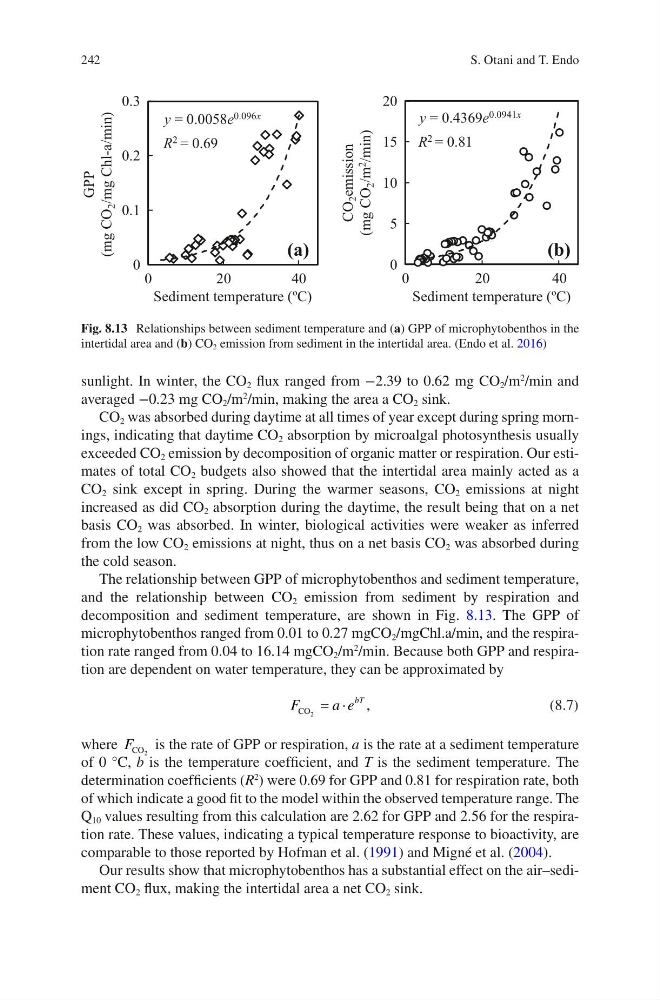
The relationship between GPP of microphytobenthos and sediment temperature,
and the relationship between CO 2 emission from sediment by respiration and
decomposition and sediment temperature, are shown in Fig. 8.13. The GPP of
microphytobenthos ranged from 0.01 to 0.27 mgCO 2 /mgChl.a/min, and the respiration rate ranged from 0.04 to 16.14 mgCO 2 /m
2
/min. Because both GPP and respiration are dependent on water temperature, they can be approximated by
F
a e
bT
CO
,
2
= ×
(8.7)
where F CO 2 is the rate of GPP or respiration, a is the rate at a sediment temperature
of 0 °C, b is the temperature coefficient, and T is the sediment temperature. The
determination coefficients (R
2
) were 0.69 for GPP and 0.81 for respiration rate, both
of which indicate a good fit to the model within the observed temperature range. The
Q 10 values resulting from this calculation are 2.62 for GPP and 2.56 for the respiration rate. These values, indicating a typical temperature response to bioactivity, are
comparable to those reported by Hofman et al. (1991) and Migné et al. (2004).
Our results show that microphytobenthos has a substantial effect on the air–sediment CO 2 flux, making the intertidal area a net CO 2 sink.
0
0.1
0.2
0.3
0
2 0
4 0
Sediment temperature (ºC)
GPP
(mg CO
2 /mg Chl-a/min)
Sediment temperature (ºC)
CO
2 emission
(mg CO
2 /m 2
/min)
0
5
10
15
20
0
2 0
4 0
(a)
(b)
R 2 = 0.69
R 2 = 0.81
y = 0.0058e 0.096x
y = 0.4369e 0.0941x
Fig. 8.13 Relationships between sediment temperature and (a) GPP of microphytobenthos in the
intertidal area and (b) CO 2 emission from sediment in the intertidal area. (Endo et al. 2016)
S. Otani and T. Endo
sunlight. In winter, the CO 2 flux ranged from −2.39 to 0.62 mg CO 2 /m
2
/min and
averaged −0.23 mg CO 2 /m
2
/min, making the area a CO 2 sink.
CO 2 was absorbed during daytime at all times of year except during spring mornings, indicating that daytime CO 2 absorption by microalgal photosynthesis usually
exceeded CO 2 emission by decomposition of organic matter or respiration. Our estimates of total CO 2 budgets also showed that the intertidal area mainly acted as a
CO 2 sink except in spring. During the warmer seasons, CO 2 emissions at night
increased as did CO 2 absorption during the daytime, the result being that on a net
basis CO 2 was absorbed. In winter, biological activities were weaker as inferred
from the low CO 2 emissions at night, thus on a net basis CO 2 was absorbed during
the cold season.
The relationship between GPP of microphytobenthos and sediment temperature,
and the relationship between CO 2 emission from sediment by respiration and
decomposition and sediment temperature, are shown in Fig. 8.13. The GPP of
microphytobenthos ranged from 0.01 to 0.27 mgCO 2 /mgChl.a/min, and the respiration rate ranged from 0.04 to 16.14 mgCO 2 /m
2
/min. Because both GPP and respiration are dependent on water temperature, they can be approximated by
F
a e
bT
CO
,
2
= ×
(8.7)
where F CO 2 is the rate of GPP or respiration, a is the rate at a sediment temperature
of 0 °C, b is the temperature coefficient, and T is the sediment temperature. The
determination coefficients (R
2
) were 0.69 for GPP and 0.81 for respiration rate, both
of which indicate a good fit to the model within the observed temperature range. The
Q 10 values resulting from this calculation are 2.62 for GPP and 2.56 for the respiration rate. These values, indicating a typical temperature response to bioactivity, are
comparable to those reported by Hofman et al. (1991) and Migné et al. (2004).
Our results show that microphytobenthos has a substantial effect on the air–sediment CO 2 flux, making the intertidal area a net CO 2 sink.
0
0.1
0.2
0.3
0
2 0
4 0
Sediment temperature (ºC)
GPP
(mg CO
2 /mg Chl-a/min)
Sediment temperature (ºC)
CO
2 emission
(mg CO
2 /m 2
/min)
0
5
10
15
20
0
2 0
4 0
(a)
(b)
R 2 = 0.69
R 2 = 0.81
y = 0.0058e 0.096x
y = 0.4369e 0.0941x
Fig. 8.13 Relationships between sediment temperature and (a) GPP of microphytobenthos in the
intertidal area and (b) CO 2 emission from sediment in the intertidal area. (Endo et al. 2016)
S. Otani and T. Endo