

241
8.4.2 Bird Sanctuary Site
8.4.2.1 Air–Sediment CO 2 Flux in Intertidal Area
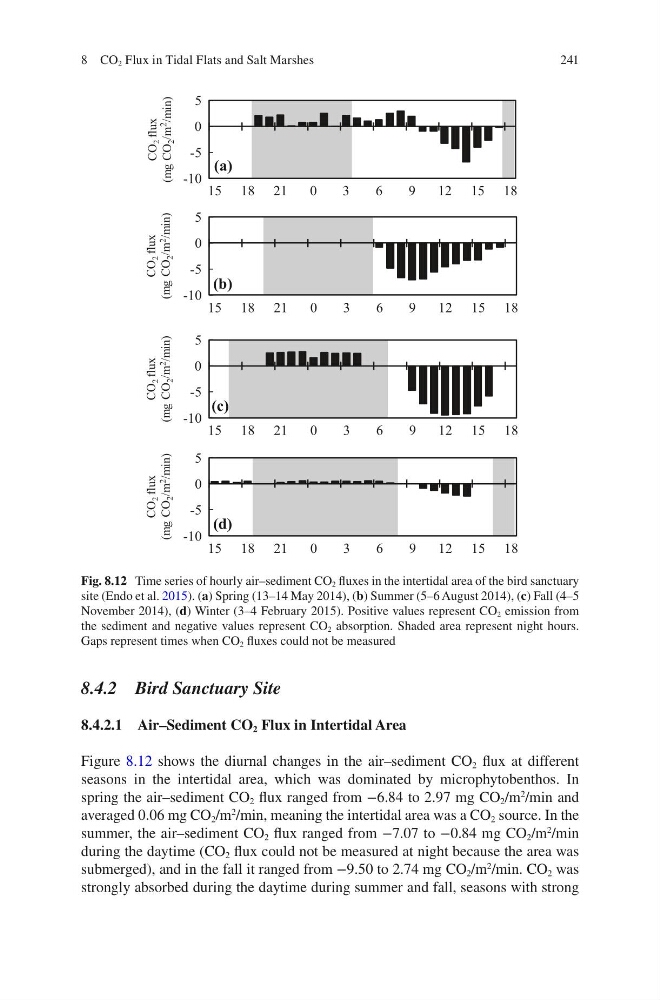
Figure 8.12 shows the diurnal changes in the air–sediment CO 2 flux at different
seasons in the intertidal area, which was dominated by microphytobenthos. In
spring the air–sediment CO 2 flux ranged from −6.84 to 2.97 mg CO 2 /m
2
/min and
averaged 0.06 mg CO 2 /m
2
/min, meaning the intertidal area was a CO 2 source. In the
summer, the air–sediment CO 2 flux ranged from −7.07 to −0.84 mg CO 2 /m
2
/min
during the daytime (CO 2 flux could not be measured at night because the area was
submerged), and in the fall it ranged from −9.50 to 2.74 mg CO 2 /m
2
/min. CO 2 was
strongly absorbed during the daytime during summer and fall, seasons with strong
-10
-5
0
5
15 18 21
0
3
6
9
12 15 18
-10
-5
0
5
15 18 21
0
3
6
9
12 15 18
-10
-5
0
5
15 18 21
0
3
6
9
12 15 18
-10
-5
0
5
15 18 21
0
3
6
9
12 15 18
CO
2 flux
(mg CO
2 /m
2
/min)
(a)
(b)
(c)
(d)
CO
2 flux
(mg CO
2 /m
2
/min)
CO
2 flux
(mg CO
2 /m
2
/min)
CO
2 flux
(mg CO
2 /m
2
/min)
Fig. 8.12 Time series of hourly air–sediment CO 2 fluxes in the intertidal area of the bird sanctuary
site (Endo et al. 2015). (a) Spring (13–14 May 2014), (b) Summer (5–6 August 2014), (c) Fall (4–5
November 2014), (d) Winter (3–4 February 2015). Positive values represent CO 2 emission from
the sediment and negative values represent CO 2 absorption. Shaded area represent night hours.
Gaps represent times when CO 2 fluxes could not be measured
8 CO 2 Flux in Tidal Flats and Salt Marshes
8.4.2 Bird Sanctuary Site
8.4.2.1 Air–Sediment CO 2 Flux in Intertidal Area
Figure 8.12 shows the diurnal changes in the air–sediment CO 2 flux at different
seasons in the intertidal area, which was dominated by microphytobenthos. In
spring the air–sediment CO 2 flux ranged from −6.84 to 2.97 mg CO 2 /m
2
/min and
averaged 0.06 mg CO 2 /m
2
/min, meaning the intertidal area was a CO 2 source. In the
summer, the air–sediment CO 2 flux ranged from −7.07 to −0.84 mg CO 2 /m
2
/min
during the daytime (CO 2 flux could not be measured at night because the area was
submerged), and in the fall it ranged from −9.50 to 2.74 mg CO 2 /m
2
/min. CO 2 was
strongly absorbed during the daytime during summer and fall, seasons with strong
-10
-5
0
5
15 18 21
0
3
6
9
12 15 18
-10
-5
0
5
15 18 21
0
3
6
9
12 15 18
-10
-5
0
5
15 18 21
0
3
6
9
12 15 18
-10
-5
0
5
15 18 21
0
3
6
9
12 15 18
CO
2 flux
(mg CO
2 /m
2
/min)
(a)
(b)
(c)
(d)
CO
2 flux
(mg CO
2 /m
2
/min)
CO
2 flux
(mg CO
2 /m
2
/min)
CO
2 flux
(mg CO
2 /m
2
/min)
Fig. 8.12 Time series of hourly air–sediment CO 2 fluxes in the intertidal area of the bird sanctuary
site (Endo et al. 2015). (a) Spring (13–14 May 2014), (b) Summer (5–6 August 2014), (c) Fall (4–5
November 2014), (d) Winter (3–4 February 2015). Positive values represent CO 2 emission from
the sediment and negative values represent CO 2 absorption. Shaded area represent night hours.
Gaps represent times when CO 2 fluxes could not be measured
8 CO 2 Flux in Tidal Flats and Salt Marshes