

240
0
5
10
15
20
CO
2 emission
(mg CO
2 /m 2
/min)
4 5 6 7 8 9 10 11 12 1 2 3
2014
2015
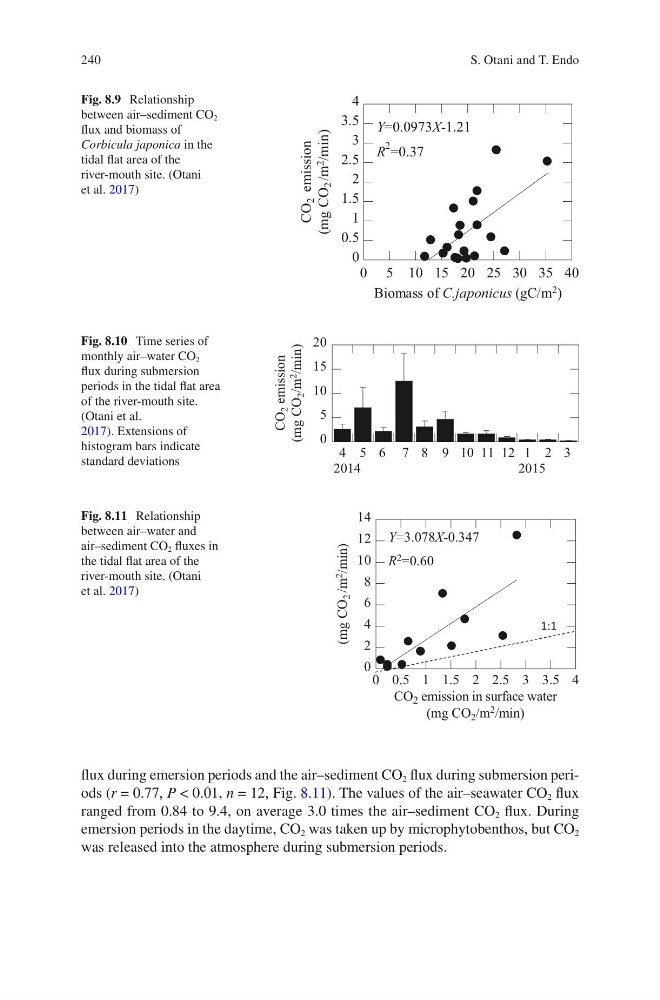
Fig. 8.10 Time series of
monthly air–water CO 2
flux during submersion
periods in the tidal flat area
of the river-mouth site.
(Otani et al.
2017). Extensions of
histogram bars indicate
standard deviations
0
2
4
6
8
10
12
14
0 0.5 1 1.5 2 2.5 3 3.5 4
(mg CO
2 /m 2
/min)
CO 2 emission in surface water
(mg CO 2 /m 2 /min)
Y=3.078X-0.347
R 2 =0.60
1:1
Fig. 8.11 Relationship
between air–water and
air–sediment CO 2 fluxes in
the tidal flat area of the
river-mouth site. (Otani
et al. 2017)
0
0.5
1
1.5
2
2.5
3
3.5
4
0 5 10 15 20 25 30 35 40
CO
2 emission
(mg CO
2 /m 2
/min)
Biomass of C.japonicus (gC/m 2 )
Y=0.0973X-1.21
R
2 =0.37
Fig. 8.9 Relationship
between air–sediment CO 2
flux and biomass of
Corbicula japonica in the
tidal flat area of the
river-mouth site. (Otani
et al. 2017)
flux during emersion periods and the air–sediment CO 2 flux during submersion periods (r = 0.77, P < 0.01, n = 12, Fig. 8.11). The values of the air–seawater CO 2 flux
ranged from 0.84 to 9.4, on average 3.0 times the air–sediment CO 2 flux. During
emersion periods in the daytime, CO 2 was taken up by microphytobenthos, but CO 2
was released into the atmosphere during submersion periods.
S. Otani and T. Endo
0
5
10
15
20
CO
2 emission
(mg CO
2 /m 2
/min)
4 5 6 7 8 9 10 11 12 1 2 3
2014
2015
Fig. 8.10 Time series of
monthly air–water CO 2
flux during submersion
periods in the tidal flat area
of the river-mouth site.
(Otani et al.
2017). Extensions of
histogram bars indicate
standard deviations
0
2
4
6
8
10
12
14
0 0.5 1 1.5 2 2.5 3 3.5 4
(mg CO
2 /m 2
/min)
CO 2 emission in surface water
(mg CO 2 /m 2 /min)
Y=3.078X-0.347
R 2 =0.60
1:1
Fig. 8.11 Relationship
between air–water and
air–sediment CO 2 fluxes in
the tidal flat area of the
river-mouth site. (Otani
et al. 2017)
0
0.5
1
1.5
2
2.5
3
3.5
4
0 5 10 15 20 25 30 35 40
CO
2 emission
(mg CO
2 /m 2
/min)
Biomass of C.japonicus (gC/m 2 )
Y=0.0973X-1.21
R
2 =0.37
Fig. 8.9 Relationship
between air–sediment CO 2
flux and biomass of
Corbicula japonica in the
tidal flat area of the
river-mouth site. (Otani
et al. 2017)
flux during emersion periods and the air–sediment CO 2 flux during submersion periods (r = 0.77, P < 0.01, n = 12, Fig. 8.11). The values of the air–seawater CO 2 flux
ranged from 0.84 to 9.4, on average 3.0 times the air–sediment CO 2 flux. During
emersion periods in the daytime, CO 2 was taken up by microphytobenthos, but CO 2
was released into the atmosphere during submersion periods.
S. Otani and T. Endo