

239
8.4.1.2 Air–Sediment CO 2 Flux in Tidal Flat
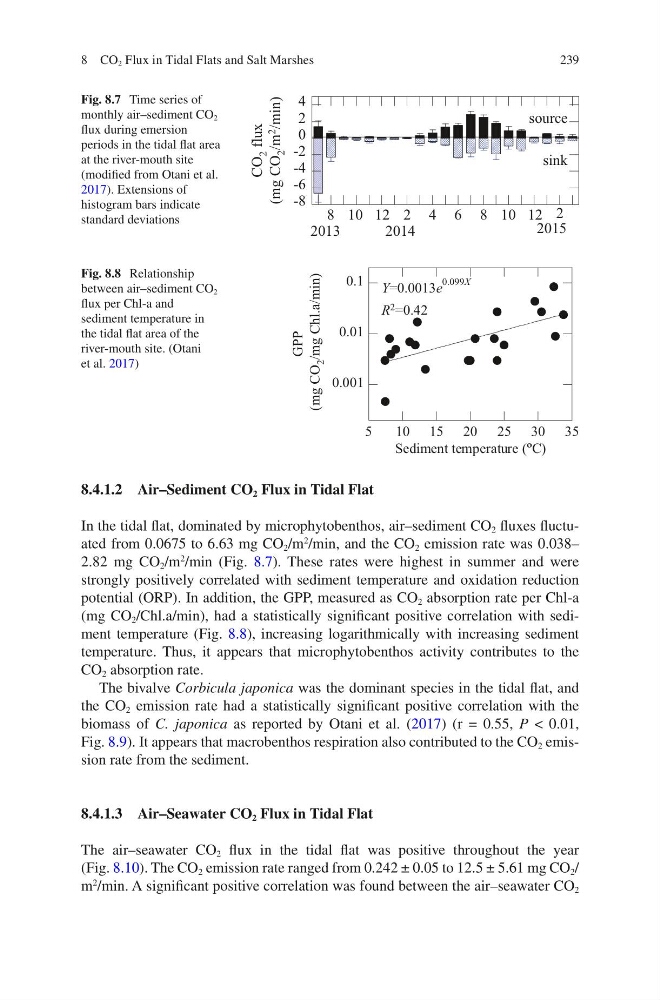
In the tidal flat, dominated by microphytobenthos, air–sediment CO 2 fluxes fluctuated from 0.0675 to 6.63 mg CO 2 /m
2
/min, and the CO 2 emission rate was 0.038–
2.82 mg CO 2 /m
2
/min (Fig. 8.7). These rates were highest in summer and were
strongly positively correlated with sediment temperature and oxidation reduction
potential (ORP). In addition, the GPP, measured as CO 2 absorption rate per Chl-a
(mg CO 2 /Chl.a/min), had a statistically significant positive correlation with sediment temperature (Fig. 8.8), increasing logarithmically with increasing sediment
temperature. Thus, it appears that microphytobenthos activity contributes to the
CO 2 absorption rate.
The bivalve Corbicula japonica was the dominant species in the tidal flat, and
the CO 2 emission rate had a statistically significant positive correlation with the
biomass of C. japonica as reported by Otani et al. (2017) (r = 0.55, P < 0.01,
Fig. 8.9). It appears that macrobenthos respiration also contributed to the CO 2 emission rate from the sediment.
8.4.1.3 Air–Seawater CO 2 Flux in Tidal Flat
The air–seawater CO 2 flux in the tidal flat was positive throughout the year
(Fig. 8.10). The CO 2 emission rate ranged from 0.242 ± 0.05 to 12.5 ± 5.61 mg CO 2 /
m
2
/min. A significant positive correlation was found between the air–seawater CO 2
-8
-6
-4
-2
0
2
4
CO
2 flux
(mg CO
2 /m 2
/min)
8 10 12 2 4 6 8 10 12 2
2013
2014
2015
sink
source
Fig. 8.7 Time series of
monthly air–sediment CO 2
flux during emersion
periods in the tidal flat area
at the river-mouth site
(modified from Otani et al.
2017). Extensions of
histogram bars indicate
standard deviations
0.001
0.01
0.1
5
10 15 20 25 30 35
GPP
(mg CO
2 /mg Chl.a/min)
Sediment temperature (ºC)
Y=0.0013e
0.099X
R 2 =0.42
Fig. 8.8 Relationship
between air–sediment CO 2
flux per Chl-a and
sediment temperature in
the tidal flat area of the
river-mouth site. (Otani
et al. 2017)
8 CO 2 Flux in Tidal Flats and Salt Marshes
8.4.1.2 Air–Sediment CO 2 Flux in Tidal Flat
In the tidal flat, dominated by microphytobenthos, air–sediment CO 2 fluxes fluctuated from 0.0675 to 6.63 mg CO 2 /m
2
/min, and the CO 2 emission rate was 0.038–
2.82 mg CO 2 /m
2
/min (Fig. 8.7). These rates were highest in summer and were
strongly positively correlated with sediment temperature and oxidation reduction
potential (ORP). In addition, the GPP, measured as CO 2 absorption rate per Chl-a
(mg CO 2 /Chl.a/min), had a statistically significant positive correlation with sediment temperature (Fig. 8.8), increasing logarithmically with increasing sediment
temperature. Thus, it appears that microphytobenthos activity contributes to the
CO 2 absorption rate.
The bivalve Corbicula japonica was the dominant species in the tidal flat, and
the CO 2 emission rate had a statistically significant positive correlation with the
biomass of C. japonica as reported by Otani et al. (2017) (r = 0.55, P < 0.01,
Fig. 8.9). It appears that macrobenthos respiration also contributed to the CO 2 emission rate from the sediment.
8.4.1.3 Air–Seawater CO 2 Flux in Tidal Flat
The air–seawater CO 2 flux in the tidal flat was positive throughout the year
(Fig. 8.10). The CO 2 emission rate ranged from 0.242 ± 0.05 to 12.5 ± 5.61 mg CO 2 /
m
2
/min. A significant positive correlation was found between the air–seawater CO 2
-8
-6
-4
-2
0
2
4
CO
2 flux
(mg CO
2 /m 2
/min)
8 10 12 2 4 6 8 10 12 2
2013
2014
2015
sink
source
Fig. 8.7 Time series of
monthly air–sediment CO 2
flux during emersion
periods in the tidal flat area
at the river-mouth site
(modified from Otani et al.
2017). Extensions of
histogram bars indicate
standard deviations
0.001
0.01
0.1
5
10 15 20 25 30 35
GPP
(mg CO
2 /mg Chl.a/min)
Sediment temperature (ºC)
Y=0.0013e
0.099X
R 2 =0.42
Fig. 8.8 Relationship
between air–sediment CO 2
flux per Chl-a and
sediment temperature in
the tidal flat area of the
river-mouth site. (Otani
et al. 2017)
8 CO 2 Flux in Tidal Flats and Salt Marshes