

243
8.4.2.2 Air–Water CO 2 Flux in Subtidal Area
We determined the diurnal pattern of air–water CO 2 flux at the subtidal area during
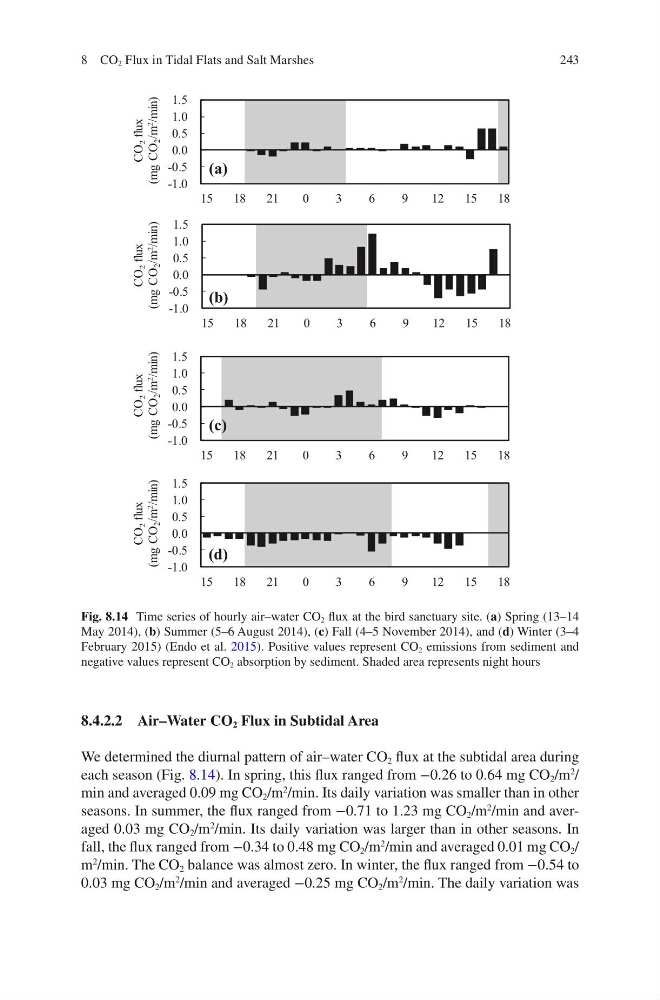
each season (Fig. 8.14). In spring, this flux ranged from −0.26 to 0.64 mg CO 2 /m
2
/
min and averaged 0.09 mg CO 2 /m
2
/min. Its daily variation was smaller than in other
seasons. In summer, the flux ranged from −0.71 to 1.23 mg CO 2 /m
2
/min and averaged 0.03 mg CO 2 /m
2
/min. Its daily variation was larger than in other seasons. In
fall, the flux ranged from −0.34 to 0.48 mg CO 2 /m
2
/min and averaged 0.01 mg CO 2 /
m
2
/min. The CO 2 balance was almost zero. In winter, the flux ranged from −0.54 to
0.03 mg CO 2 /m
2
/min and averaged −0.25 mg CO 2 /m
2
/min. The daily variation was
(a)
(b)
(c)
(d)
-1.0
-0.5
0.0
0.5
1.0
1.5
15
18
21
0
3
6
9
12
15
18
-1.0
-0.5
0.0
0.5
1.0
1.5
15
18
21
0
3
6
9
12
15
18
-1.0
-0.5
0.0
0.5
1.0
1.5
15
18
21
0
3
6
9
12
15
18
CO
2 flux
(mg CO
2 /m 2
/min)
CO
2 flux
(mg CO
2 /m 2
/min)
CO
2 flux
(mg CO
2 /m 2
/min)
CO
2 flux
(mg CO
2 /m 2
/min)
-1.0
-0.5
0.0
0.5
1.0
1.5
15
18
21
0
3
6
9
12
15
18
Fig. 8.14 Time series of hourly air–water CO 2 flux at the bird sanctuary site. (a) Spring (13–14
May 2014), (b) Summer (5–6 August 2014), (c) Fall (4–5 November 2014), and (d) Winter (3–4
February 2015) (Endo et al. 2015). Positive values represent CO 2 emissions from sediment and
negative values represent CO 2 absorption by sediment. Shaded area represents night hours
8 CO 2 Flux in Tidal Flats and Salt Marshes
8.4.2.2 Air–Water CO 2 Flux in Subtidal Area
We determined the diurnal pattern of air–water CO 2 flux at the subtidal area during
each season (Fig. 8.14). In spring, this flux ranged from −0.26 to 0.64 mg CO 2 /m
2
/
min and averaged 0.09 mg CO 2 /m
2
/min. Its daily variation was smaller than in other
seasons. In summer, the flux ranged from −0.71 to 1.23 mg CO 2 /m
2
/min and averaged 0.03 mg CO 2 /m
2
/min. Its daily variation was larger than in other seasons. In
fall, the flux ranged from −0.34 to 0.48 mg CO 2 /m
2
/min and averaged 0.01 mg CO 2 /
m
2
/min. The CO 2 balance was almost zero. In winter, the flux ranged from −0.54 to
0.03 mg CO 2 /m
2
/min and averaged −0.25 mg CO 2 /m
2
/min. The daily variation was
(a)
(b)
(c)
(d)
-1.0
-0.5
0.0
0.5
1.0
1.5
15
18
21
0
3
6
9
12
15
18
-1.0
-0.5
0.0
0.5
1.0
1.5
15
18
21
0
3
6
9
12
15
18
-1.0
-0.5
0.0
0.5
1.0
1.5
15
18
21
0
3
6
9
12
15
18
CO
2 flux
(mg CO
2 /m 2
/min)
CO
2 flux
(mg CO
2 /m 2
/min)
CO
2 flux
(mg CO
2 /m 2
/min)
CO
2 flux
(mg CO
2 /m 2
/min)
-1.0
-0.5
0.0
0.5
1.0
1.5
15
18
21
0
3
6
9
12
15
18
Fig. 8.14 Time series of hourly air–water CO 2 flux at the bird sanctuary site. (a) Spring (13–14
May 2014), (b) Summer (5–6 August 2014), (c) Fall (4–5 November 2014), and (d) Winter (3–4
February 2015) (Endo et al. 2015). Positive values represent CO 2 emissions from sediment and
negative values represent CO 2 absorption by sediment. Shaded area represents night hours
8 CO 2 Flux in Tidal Flats and Salt Marshes