

236
was positive and the air temperature was lower than the sediment temperature. At
night, the sediment temperature was lower than the air temperature. Group C was
defined as months with no clear fluctuations in the CO 2 flux (November 2014 and
February and July 2015). The characteristics of the CO 2 flux are summarized in
Fig. 8.6.
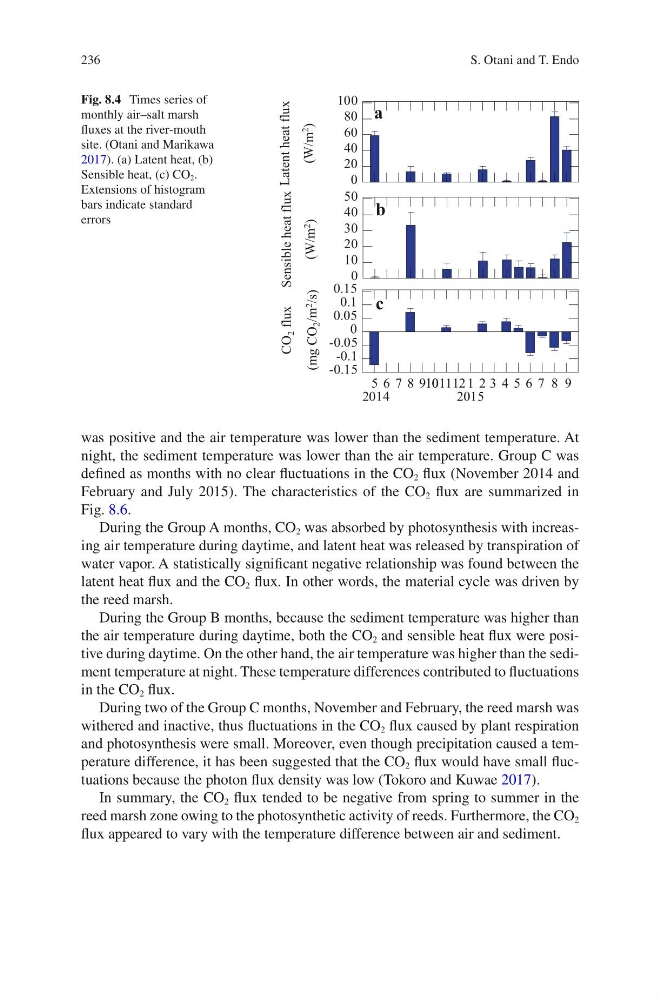
During the Group A months, CO 2 was absorbed by photosynthesis with increasing air temperature during daytime, and latent heat was released by transpiration of
water vapor. A statistically significant negative relationship was found between the
latent heat flux and the CO 2 flux. In other words, the material cycle was driven by
the reed marsh.
During the Group B months, because the sediment temperature was higher than
the air temperature during daytime, both the CO 2 and sensible heat flux were positive during daytime. On the other hand, the air temperature was higher than the sediment temperature at night. These temperature differences contributed to fluctuations
in the CO 2 flux.
During two of the Group C months, November and February, the reed marsh was
withered and inactive, thus fluctuations in the CO 2 flux caused by plant respiration
and photosynthesis were small. Moreover, even though precipitation caused a temperature difference, it has been suggested that the CO 2 flux would have small fluctuations because the photon flux density was low (Tokoro and Kuwae 2017).
In summary, the CO 2 flux tended to be negative from spring to summer in the
reed marsh zone owing to the photosynthetic activity of reeds. Furthermore, the CO 2
flux appeared to vary with the temperature difference between air and sediment.
0
20
40
60
80
100
Latent heat flux
(W/m 2
)
0
10
20
30
40
50
Sensible heat flux
(W/m 2
)
-0.15
-0.1
-0.05
0
0.05
0.1
0.15
CO
2 flux
(mg CO
2 /m 2
/s)
5
8
11
2 4 5 6 7 8 9
2015
2014
3
12 1
910 10
7
6
a
b
c
Fig. 8.4 Times series of
monthly air–salt marsh
fluxes at the river-mouth
site. (Otani and Marikawa
2017). (a) Latent heat, (b)
Sensible heat, (c) CO 2 .
Extensions of histogram
bars indicate standard
errors
S. Otani and T. Endo
was positive and the air temperature was lower than the sediment temperature. At
night, the sediment temperature was lower than the air temperature. Group C was
defined as months with no clear fluctuations in the CO 2 flux (November 2014 and
February and July 2015). The characteristics of the CO 2 flux are summarized in
Fig. 8.6.
During the Group A months, CO 2 was absorbed by photosynthesis with increasing air temperature during daytime, and latent heat was released by transpiration of
water vapor. A statistically significant negative relationship was found between the
latent heat flux and the CO 2 flux. In other words, the material cycle was driven by
the reed marsh.
During the Group B months, because the sediment temperature was higher than
the air temperature during daytime, both the CO 2 and sensible heat flux were positive during daytime. On the other hand, the air temperature was higher than the sediment temperature at night. These temperature differences contributed to fluctuations
in the CO 2 flux.
During two of the Group C months, November and February, the reed marsh was
withered and inactive, thus fluctuations in the CO 2 flux caused by plant respiration
and photosynthesis were small. Moreover, even though precipitation caused a temperature difference, it has been suggested that the CO 2 flux would have small fluctuations because the photon flux density was low (Tokoro and Kuwae 2017).
In summary, the CO 2 flux tended to be negative from spring to summer in the
reed marsh zone owing to the photosynthetic activity of reeds. Furthermore, the CO 2
flux appeared to vary with the temperature difference between air and sediment.
0
20
40
60
80
100
Latent heat flux
(W/m 2
)
0
10
20
30
40
50
Sensible heat flux
(W/m 2
)
-0.15
-0.1
-0.05
0
0.05
0.1
0.15
CO
2 flux
(mg CO
2 /m 2
/s)
5
8
11
2 4 5 6 7 8 9
2015
2014
3
12 1
910 10
7
6
a
b
c
Fig. 8.4 Times series of
monthly air–salt marsh
fluxes at the river-mouth
site. (Otani and Marikawa
2017). (a) Latent heat, (b)
Sensible heat, (c) CO 2 .
Extensions of histogram
bars indicate standard
errors
S. Otani and T. Endo