

235
concentrations at times t and t + Δt, respectively; V is the volume of the chamber;
and A is the area of the base of the chamber. Subscripts L and D represent the light
and dark chambers, respectively. The difference between the CO 2 fluxes of the light
and dark chambers was defined as GPP of microphytobenthos on the sediment.
In contrast, air–water CO 2 exchange responds to temporal changes of CO 2 in
water, which arise not only from biological process but also from changes in water
quality. Because it is difficult to analyze these factors using data from light and dark
chambers, we measured the air–water CO 2 flux with a light chamber.
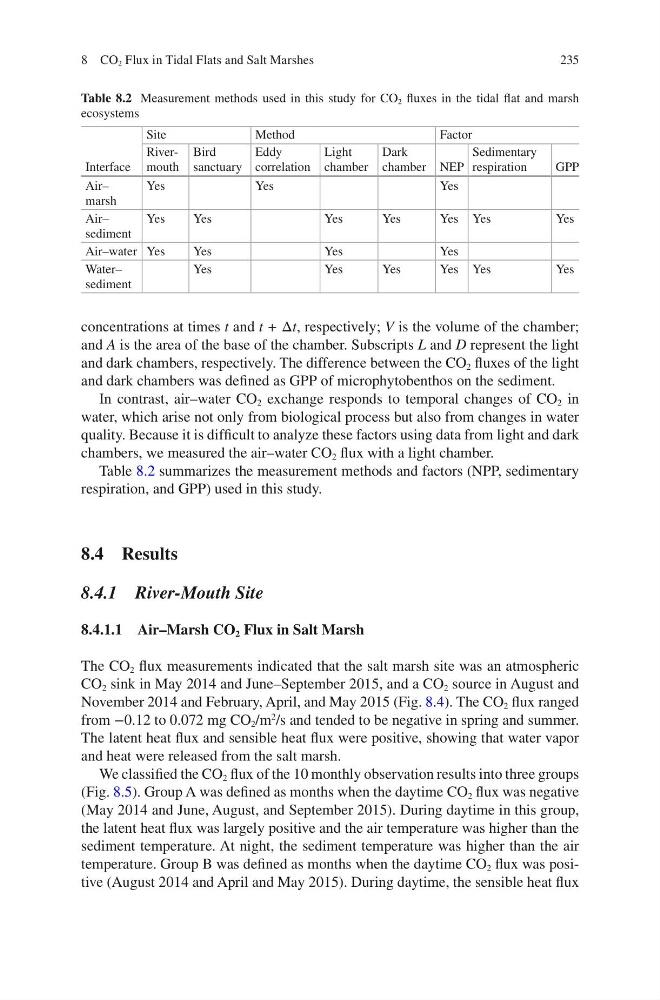
Table 8.2 summarizes the measurement methods and factors (NPP, sedimentary
respiration, and GPP) used in this study.
8.4 Results
8.4.1 River-Mouth Site
8.4.1.1 Air–Marsh CO 2 Flux in Salt Marsh
The CO 2 flux measurements indicated that the salt marsh site was an atmospheric
CO 2 sink in May 2014 and June–September 2015, and a CO 2 source in August and
November 2014 and February, April, and May 2015 (Fig. 8.4). The CO 2 flux ranged
from −0.12 to 0.072 mg CO 2 /m
2
/s and tended to be negative in spring and summer.
The latent heat flux and sensible heat flux were positive, showing that water vapor
and heat were released from the salt marsh.
We classified the CO 2 flux of the 10 monthly observation results into three groups
(Fig. 8.5). Group A was defined as months when the daytime CO 2 flux was negative
(May 2014 and June, August, and September 2015). During daytime in this group,
the latent heat flux was largely positive and the air temperature was higher than the
sediment temperature. At night, the sediment temperature was higher than the air
temperature. Group B was defined as months when the daytime CO 2 flux was positive (August 2014 and April and May 2015). During daytime, the sensible heat flux
Table 8.2 Measurement methods used in this study for CO 2 fluxes in the tidal flat and marsh
ecosystems
Interface
Site
Method
Factor
Rivermouth
Bird
sanctuary
Eddy
correlation
Light
chamber
Dark
chamber NEP
Sedimentary
respiration
GPP
Air–
marsh
Yes
Yes
Yes
Air–
sediment
Yes
Yes
Yes
Yes
Yes Yes
Yes
Air–water Yes
Yes
Yes
Yes
Water–
sediment
Yes
Yes
Yes
Yes Yes
Yes
8 CO 2 Flux in Tidal Flats and Salt Marshes
concentrations at times t and t + Δt, respectively; V is the volume of the chamber;
and A is the area of the base of the chamber. Subscripts L and D represent the light
and dark chambers, respectively. The difference between the CO 2 fluxes of the light
and dark chambers was defined as GPP of microphytobenthos on the sediment.
In contrast, air–water CO 2 exchange responds to temporal changes of CO 2 in
water, which arise not only from biological process but also from changes in water
quality. Because it is difficult to analyze these factors using data from light and dark
chambers, we measured the air–water CO 2 flux with a light chamber.
Table 8.2 summarizes the measurement methods and factors (NPP, sedimentary
respiration, and GPP) used in this study.
8.4 Results
8.4.1 River-Mouth Site
8.4.1.1 Air–Marsh CO 2 Flux in Salt Marsh
The CO 2 flux measurements indicated that the salt marsh site was an atmospheric
CO 2 sink in May 2014 and June–September 2015, and a CO 2 source in August and
November 2014 and February, April, and May 2015 (Fig. 8.4). The CO 2 flux ranged
from −0.12 to 0.072 mg CO 2 /m
2
/s and tended to be negative in spring and summer.
The latent heat flux and sensible heat flux were positive, showing that water vapor
and heat were released from the salt marsh.
We classified the CO 2 flux of the 10 monthly observation results into three groups
(Fig. 8.5). Group A was defined as months when the daytime CO 2 flux was negative
(May 2014 and June, August, and September 2015). During daytime in this group,
the latent heat flux was largely positive and the air temperature was higher than the
sediment temperature. At night, the sediment temperature was higher than the air
temperature. Group B was defined as months when the daytime CO 2 flux was positive (August 2014 and April and May 2015). During daytime, the sensible heat flux
Table 8.2 Measurement methods used in this study for CO 2 fluxes in the tidal flat and marsh
ecosystems
Interface
Site
Method
Factor
Rivermouth
Bird
sanctuary
Eddy
correlation
Light
chamber
Dark
chamber NEP
Sedimentary
respiration
GPP
Air–
marsh
Yes
Yes
Yes
Air–
sediment
Yes
Yes
Yes
Yes
Yes Yes
Yes
Air–water Yes
Yes
Yes
Yes
Water–
sediment
Yes
Yes
Yes
Yes Yes
Yes
8 CO 2 Flux in Tidal Flats and Salt Marshes