

176
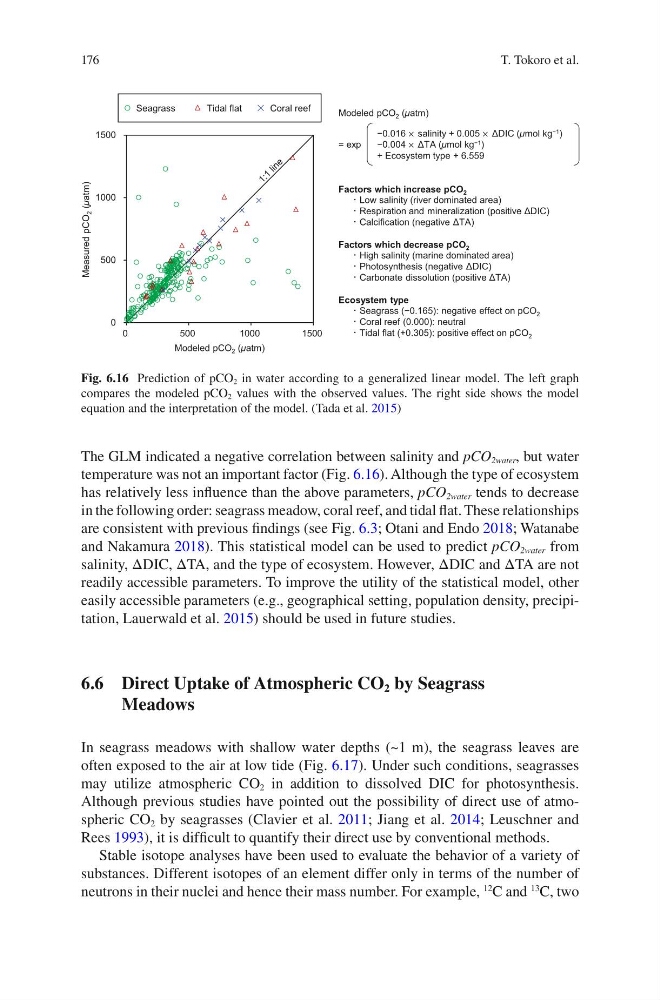
The GLM indicated a negative correlation between salinity and pCO 2water , but water
temperature was not an important factor (Fig. 6.16). Although the type of ecosystem
has relatively less influence than the above parameters, pCO 2water tends to decrease
in the following order: seagrass meadow, coral reef, and tidal flat. These relationships
are consistent with previous findings (see Fig. 6.3; Otani and Endo 2018; Watanabe
and Nakamura 2018). This statistical model can be used to predict pCO 2water from
salinity, ΔDIC, ΔTA, and the type of ecosystem. However, ΔDIC and ΔTA are not
readily accessible parameters. To improve the utility of the statistical model, other
easily accessible parameters (e.g., geographical setting, population density, precipitation, Lauerwald et al. 2015) should be used in future studies.
6.6 Direct Uptake of Atmospheric CO 2 by Seagrass
Meadows
In seagrass meadows with shallow water depths (~1 m), the seagrass leaves are
often exposed to the air at low tide (Fig. 6.17). Under such conditions, seagrasses
may utilize atmospheric CO 2 in addition to dissolved DIC for photosynthesis.
Although previous studies have pointed out the possibility of direct use of atmospheric CO 2 by seagrasses (Clavier et al. 2011; Jiang et al. 2014; Leuschner and
Rees 1993), it is difficult to quantify their direct use by conventional methods.
Stable isotope analyses have been used to evaluate the behavior of a variety of
substances. Different isotopes of an element differ only in terms of the number of
neutrons in their nuclei and hence their mass number. For example,
12
C and
13
C, two
Factors which increase pCO 2
ʀLow salinity (river dominated area)
ʀRespiration and mineralization (positive ΔDIC)
ʀCalcification (negative ΔTA)
Factors which decrease pCO 2
ʀHigh salinity (marine dominated area)
ʀPhotosynthesis (negative ΔDIC)
ʀCarbonate dissolution (positive ΔTA)
Ecosystem type
ʀSeagrass (−0.165): negative effect on pCO 2
ʀCoral reef (0.000): neutral
ʀTidal flat (+0.305): positive effect on pCO 2
0
500
1000
1500
0
5 00
1000
1500
Seagrass
T idal flat
Coral reef
Measured pCO
2 (µatm)
Modeled pCO 2 (µatm)
Modeled pCO 2 (µatm)
= exp
−0.016 × salinity + 0.005 × ΔDIC (µmol kg −1 )
−0.004 × ΔTA (µmol kg −1 )
+ Ecosystem type + 6.559
Fig. 6.16 Prediction of pCO 2 in water according to a generalized linear model. The left graph
compares the modeled pCO 2 values with the observed values. The right side shows the model
equation and the interpretation of the model. (Tada et al. 2015)
T. Tokoro et al.
The GLM indicated a negative correlation between salinity and pCO 2water , but water
temperature was not an important factor (Fig. 6.16). Although the type of ecosystem
has relatively less influence than the above parameters, pCO 2water tends to decrease
in the following order: seagrass meadow, coral reef, and tidal flat. These relationships
are consistent with previous findings (see Fig. 6.3; Otani and Endo 2018; Watanabe
and Nakamura 2018). This statistical model can be used to predict pCO 2water from
salinity, ΔDIC, ΔTA, and the type of ecosystem. However, ΔDIC and ΔTA are not
readily accessible parameters. To improve the utility of the statistical model, other
easily accessible parameters (e.g., geographical setting, population density, precipitation, Lauerwald et al. 2015) should be used in future studies.
6.6 Direct Uptake of Atmospheric CO 2 by Seagrass
Meadows
In seagrass meadows with shallow water depths (~1 m), the seagrass leaves are
often exposed to the air at low tide (Fig. 6.17). Under such conditions, seagrasses
may utilize atmospheric CO 2 in addition to dissolved DIC for photosynthesis.
Although previous studies have pointed out the possibility of direct use of atmospheric CO 2 by seagrasses (Clavier et al. 2011; Jiang et al. 2014; Leuschner and
Rees 1993), it is difficult to quantify their direct use by conventional methods.
Stable isotope analyses have been used to evaluate the behavior of a variety of
substances. Different isotopes of an element differ only in terms of the number of
neutrons in their nuclei and hence their mass number. For example,
12
C and
13
C, two
Factors which increase pCO 2
ʀLow salinity (river dominated area)
ʀRespiration and mineralization (positive ΔDIC)
ʀCalcification (negative ΔTA)
Factors which decrease pCO 2
ʀHigh salinity (marine dominated area)
ʀPhotosynthesis (negative ΔDIC)
ʀCarbonate dissolution (positive ΔTA)
Ecosystem type
ʀSeagrass (−0.165): negative effect on pCO 2
ʀCoral reef (0.000): neutral
ʀTidal flat (+0.305): positive effect on pCO 2
0
500
1000
1500
0
5 00
1000
1500
Seagrass
T idal flat
Coral reef
Measured pCO
2 (µatm)
Modeled pCO 2 (µatm)
Modeled pCO 2 (µatm)
= exp
−0.016 × salinity + 0.005 × ΔDIC (µmol kg −1 )
−0.004 × ΔTA (µmol kg −1 )
+ Ecosystem type + 6.559
Fig. 6.16 Prediction of pCO 2 in water according to a generalized linear model. The left graph
compares the modeled pCO 2 values with the observed values. The right side shows the model
equation and the interpretation of the model. (Tada et al. 2015)
T. Tokoro et al.