

171
lower in the Sargassum bed than in the adjacent waters. Given that the atmospheric
pCO 2 ranged from 360 to 400 μatm, the adjacent waters, which were originally CO 2
neutral to the atmosphere, changed to CO 2 sinks over the Sargassum bed.
A previous study also demonstrated using the eddy covariance method that a
giant kelp bed off the Californian coast absorbs atmospheric CO 2 (Ikawa and Oechel
2014). Future studies should fill the spatial and temporal gaps in the observations
and will contribute to a better understanding of the role of macroalgal beds as CO 2
sinks.
Temperature (° C) / salinity
DIC (µmol kg −1
-water)
fCO
2 (µatm)
Time (hour)
12
24
36
48
60
72
0
0
10
20
30
Influx
Efflux
(a)
(b)
(c)
1000
1500
2000
0
500
1000
1500
fCO 2 w/o NEP
fCO 2
DIC w/o NEP
DIC
Salinity
Temperature
Air fCO 2
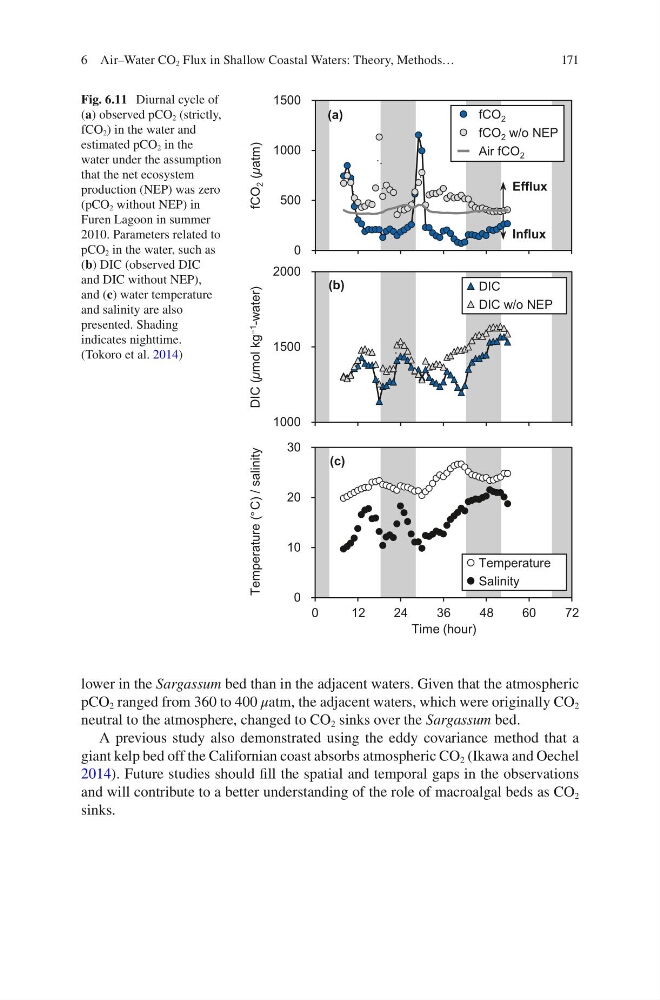
Fig. 6.11 Diurnal cycle of
(a) observed pCO 2 (strictly,
fCO 2 ) in the water and
estimated pCO 2 in the
water under the assumption
that the net ecosystem
production (NEP) was zero
(pCO 2 without NEP) in
Furen Lagoon in summer
2010. Parameters related to
pCO 2 in the water, such as
(b) DIC (observed DIC
and DIC without NEP),
and (c) water temperature
and salinity are also
presented. Shading
indicates nighttime.
(Tokoro et al. 2014)
6 Air–Water CO 2 Flux in Shallow Coastal Waters: Theory, Methods…
lower in the Sargassum bed than in the adjacent waters. Given that the atmospheric
pCO 2 ranged from 360 to 400 μatm, the adjacent waters, which were originally CO 2
neutral to the atmosphere, changed to CO 2 sinks over the Sargassum bed.
A previous study also demonstrated using the eddy covariance method that a
giant kelp bed off the Californian coast absorbs atmospheric CO 2 (Ikawa and Oechel
2014). Future studies should fill the spatial and temporal gaps in the observations
and will contribute to a better understanding of the role of macroalgal beds as CO 2
sinks.
Temperature (° C) / salinity
DIC (µmol kg −1
-water)
fCO
2 (µatm)
Time (hour)
12
24
36
48
60
72
0
0
10
20
30
Influx
Efflux
(a)
(b)
(c)
1000
1500
2000
0
500
1000
1500
fCO 2 w/o NEP
fCO 2
DIC w/o NEP
DIC
Salinity
Temperature
Air fCO 2
Fig. 6.11 Diurnal cycle of
(a) observed pCO 2 (strictly,
fCO 2 ) in the water and
estimated pCO 2 in the
water under the assumption
that the net ecosystem
production (NEP) was zero
(pCO 2 without NEP) in
Furen Lagoon in summer
2010. Parameters related to
pCO 2 in the water, such as
(b) DIC (observed DIC
and DIC without NEP),
and (c) water temperature
and salinity are also
presented. Shading
indicates nighttime.
(Tokoro et al. 2014)
6 Air–Water CO 2 Flux in Shallow Coastal Waters: Theory, Methods…