

144
taken up by organisms through the process of photosynthesis and the food web, so
it can be thought as the carbon storage of the salt marsh. Here, we investigated the
carbon accumulated into the sedimentary layer of the intertidal and subtidal zones
at the bird sanctuary. Biodegradation tests of sediment taken from the salt marsh
were carried out for 100 days, and the remaining organic matter was evaluated as
the carbon accumulation of the sediment layer.
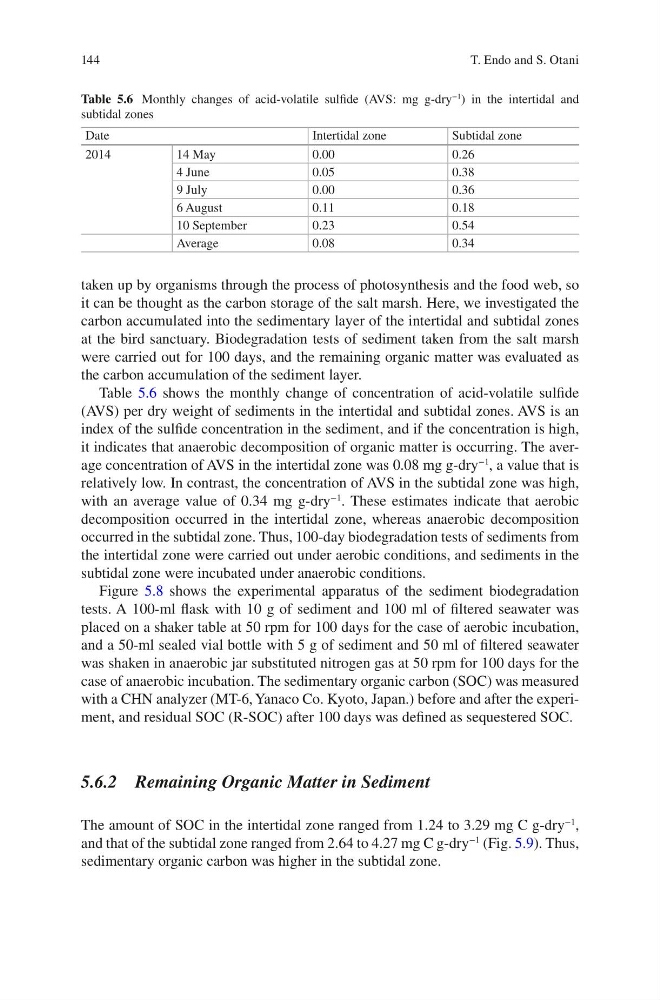
Table 5.6 shows the monthly change of concentration of acid-volatile sulfide
(AVS) per dry weight of sediments in the intertidal and subtidal zones. AVS is an
index of the sulfide concentration in the sediment, and if the concentration is high,
it indicates that anaerobic decomposition of organic matter is occurring. The average concentration of AVS in the intertidal zone was 0.08 mg g-dry
−1
, a value that is
relatively low. In contrast, the concentration of AVS in the subtidal zone was high,
with an average value of 0.34 mg g-dry
−1
. These estimates indicate that aerobic
decomposition occurred in the intertidal zone, whereas anaerobic decomposition
occurred in the subtidal zone. Thus, 100-day biodegradation tests of sediments from
the intertidal zone were carried out under aerobic conditions, and sediments in the
subtidal zone were incubated under anaerobic conditions.
Figure 5.8 shows the experimental apparatus of the sediment biodegradation
tests. A 100-ml flask with 10 g of sediment and 100 ml of filtered seawater was
placed on a shaker table at 50 rpm for 100 days for the case of aerobic incubation,
and a 50-ml sealed vial bottle with 5 g of sediment and 50 ml of filtered seawater
was shaken in anaerobic jar substituted nitrogen gas at 50 rpm for 100 days for the
case of anaerobic incubation. The sedimentary organic carbon (SOC) was measured
with a CHN analyzer (MT-6, Yanaco Co. Kyoto, Japan.) before and after the experiment, and residual SOC (R-SOC) after 100 days was defined as sequestered SOC.
5.6.2 Remaining Organic Matter in Sediment
The amount of SOC in the intertidal zone ranged from 1.24 to 3.29 mg C g-dry
−1
,
and that of the subtidal zone ranged from 2.64 to 4.27 mg C g-dry
−1
(Fig. 5.9). Thus,
sedimentary organic carbon was higher in the subtidal zone.
Table 5.6 Monthly changes of acid-volatile sulfide (AVS: mg g-dry
−1
) in the intertidal and
subtidal zones
Date
Intertidal zone
Subtidal zone
2014
14 May
0.00
0.26
4 June
0.05
0.38
9 July
0.00
0.36
6 August
0.11
0.18
10 September
0.23
0.54
Average
0.08
0.34
T. Endo and S. Otani
taken up by organisms through the process of photosynthesis and the food web, so
it can be thought as the carbon storage of the salt marsh. Here, we investigated the
carbon accumulated into the sedimentary layer of the intertidal and subtidal zones
at the bird sanctuary. Biodegradation tests of sediment taken from the salt marsh
were carried out for 100 days, and the remaining organic matter was evaluated as
the carbon accumulation of the sediment layer.
Table 5.6 shows the monthly change of concentration of acid-volatile sulfide
(AVS) per dry weight of sediments in the intertidal and subtidal zones. AVS is an
index of the sulfide concentration in the sediment, and if the concentration is high,
it indicates that anaerobic decomposition of organic matter is occurring. The average concentration of AVS in the intertidal zone was 0.08 mg g-dry
−1
, a value that is
relatively low. In contrast, the concentration of AVS in the subtidal zone was high,
with an average value of 0.34 mg g-dry
−1
. These estimates indicate that aerobic
decomposition occurred in the intertidal zone, whereas anaerobic decomposition
occurred in the subtidal zone. Thus, 100-day biodegradation tests of sediments from
the intertidal zone were carried out under aerobic conditions, and sediments in the
subtidal zone were incubated under anaerobic conditions.
Figure 5.8 shows the experimental apparatus of the sediment biodegradation
tests. A 100-ml flask with 10 g of sediment and 100 ml of filtered seawater was
placed on a shaker table at 50 rpm for 100 days for the case of aerobic incubation,
and a 50-ml sealed vial bottle with 5 g of sediment and 50 ml of filtered seawater
was shaken in anaerobic jar substituted nitrogen gas at 50 rpm for 100 days for the
case of anaerobic incubation. The sedimentary organic carbon (SOC) was measured
with a CHN analyzer (MT-6, Yanaco Co. Kyoto, Japan.) before and after the experiment, and residual SOC (R-SOC) after 100 days was defined as sequestered SOC.
5.6.2 Remaining Organic Matter in Sediment
The amount of SOC in the intertidal zone ranged from 1.24 to 3.29 mg C g-dry
−1
,
and that of the subtidal zone ranged from 2.64 to 4.27 mg C g-dry
−1
(Fig. 5.9). Thus,
sedimentary organic carbon was higher in the subtidal zone.
Table 5.6 Monthly changes of acid-volatile sulfide (AVS: mg g-dry
−1
) in the intertidal and
subtidal zones
Date
Intertidal zone
Subtidal zone
2014
14 May
0.00
0.26
4 June
0.05
0.38
9 July
0.00
0.36
6 August
0.11
0.18
10 September
0.23
0.54
Average
0.08
0.34
T. Endo and S. Otani