

143
5.5.3 Effect of Water Column NEP on Carbon Cycling
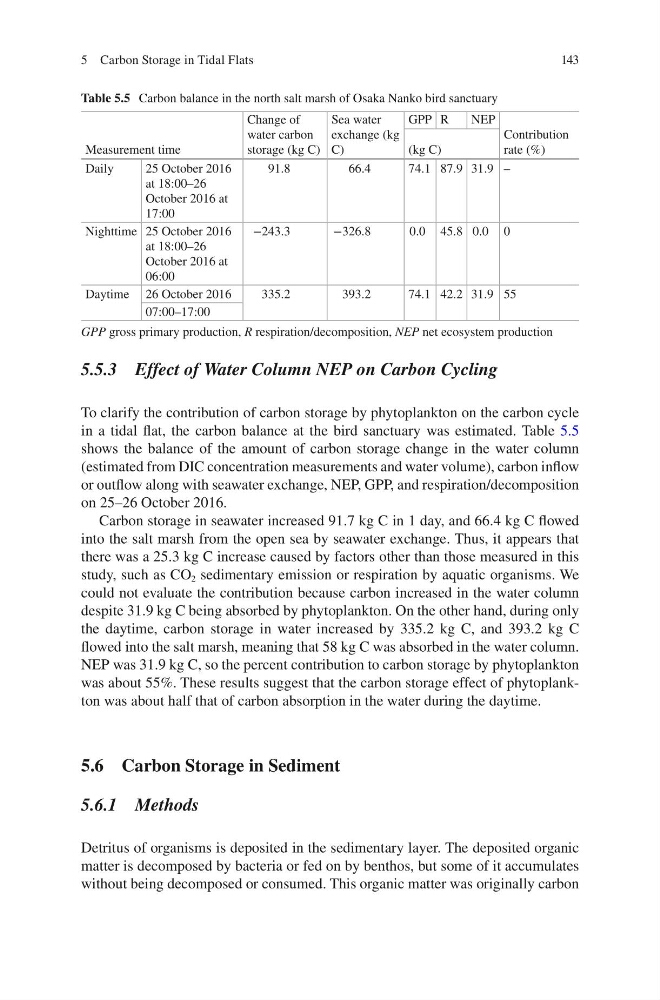
To clarify the contribution of carbon storage by phytoplankton on the carbon cycle
in a tidal flat, the carbon balance at the bird sanctuary was estimated. Table 5.5
shows the balance of the amount of carbon storage change in the water column
(estimated from DIC concentration measurements and water volume), carbon inflow
or outflow along with seawater exchange, NEP, GPP, and respiration/decomposition
on 25–26 October 2016.
Carbon storage in seawater increased 91.7 kg C in 1 day, and 66.4 kg C flowed
into the salt marsh from the open sea by seawater exchange. Thus, it appears that
there was a 25.3 kg C increase caused by factors other than those measured in this
study, such as CO 2 sedimentary emission or respiration by aquatic organisms. We
could not evaluate the contribution because carbon increased in the water column
despite 31.9 kg C being absorbed by phytoplankton. On the other hand, during only
the daytime, carbon storage in water increased by 335.2 kg C, and 393.2 kg C
flowed into the salt marsh, meaning that 58 kg C was absorbed in the water column.
NEP was 31.9 kg C, so the percent contribution to carbon storage by phytoplankton
was about 55%. These results suggest that the carbon storage effect of phytoplankton was about half that of carbon absorption in the water during the daytime.
5.6 Carbon Storage in Sediment
5.6.1 Methods
Detritus of organisms is deposited in the sedimentary layer. The deposited organic
matter is decomposed by bacteria or fed on by benthos, but some of it accumulates
without being decomposed or consumed. This organic matter was originally carbon
Table 5.5 Carbon balance in the north salt marsh of Osaka Nanko bird sanctuary
Measurement time
Change of
water carbon
storage (kg C)
Sea water
exchange (kg
C)
GPP R
NEP
Contribution
rate (%)
(kg C)
Daily
25 October 2016
at 18:00–26
October 2016 at
17:00
91.8
66.4
74.1 87.9 31.9 –
Nighttime 25 October 2016
at 18:00–26
October 2016 at
06:00
−243.3
−326.8
0.0 45.8 0.0 0
Daytime 26 October 2016
335.2
393.2
74.1 42.2 31.9 55
07:00–17:00
GPP gross primary production, R respiration/decomposition, NEP net ecosystem production
5 Carbon Storage in Tidal Flats
5.5.3 Effect of Water Column NEP on Carbon Cycling
To clarify the contribution of carbon storage by phytoplankton on the carbon cycle
in a tidal flat, the carbon balance at the bird sanctuary was estimated. Table 5.5
shows the balance of the amount of carbon storage change in the water column
(estimated from DIC concentration measurements and water volume), carbon inflow
or outflow along with seawater exchange, NEP, GPP, and respiration/decomposition
on 25–26 October 2016.
Carbon storage in seawater increased 91.7 kg C in 1 day, and 66.4 kg C flowed
into the salt marsh from the open sea by seawater exchange. Thus, it appears that
there was a 25.3 kg C increase caused by factors other than those measured in this
study, such as CO 2 sedimentary emission or respiration by aquatic organisms. We
could not evaluate the contribution because carbon increased in the water column
despite 31.9 kg C being absorbed by phytoplankton. On the other hand, during only
the daytime, carbon storage in water increased by 335.2 kg C, and 393.2 kg C
flowed into the salt marsh, meaning that 58 kg C was absorbed in the water column.
NEP was 31.9 kg C, so the percent contribution to carbon storage by phytoplankton
was about 55%. These results suggest that the carbon storage effect of phytoplankton was about half that of carbon absorption in the water during the daytime.
5.6 Carbon Storage in Sediment
5.6.1 Methods
Detritus of organisms is deposited in the sedimentary layer. The deposited organic
matter is decomposed by bacteria or fed on by benthos, but some of it accumulates
without being decomposed or consumed. This organic matter was originally carbon
Table 5.5 Carbon balance in the north salt marsh of Osaka Nanko bird sanctuary
Measurement time
Change of
water carbon
storage (kg C)
Sea water
exchange (kg
C)
GPP R
NEP
Contribution
rate (%)
(kg C)
Daily
25 October 2016
at 18:00–26
October 2016 at
17:00
91.8
66.4
74.1 87.9 31.9 –
Nighttime 25 October 2016
at 18:00–26
October 2016 at
06:00
−243.3
−326.8
0.0 45.8 0.0 0
Daytime 26 October 2016
335.2
393.2
74.1 42.2 31.9 55
07:00–17:00
GPP gross primary production, R respiration/decomposition, NEP net ecosystem production
5 Carbon Storage in Tidal Flats