

2. Methods of Estimating Aboveground Net Primary Productivity
33
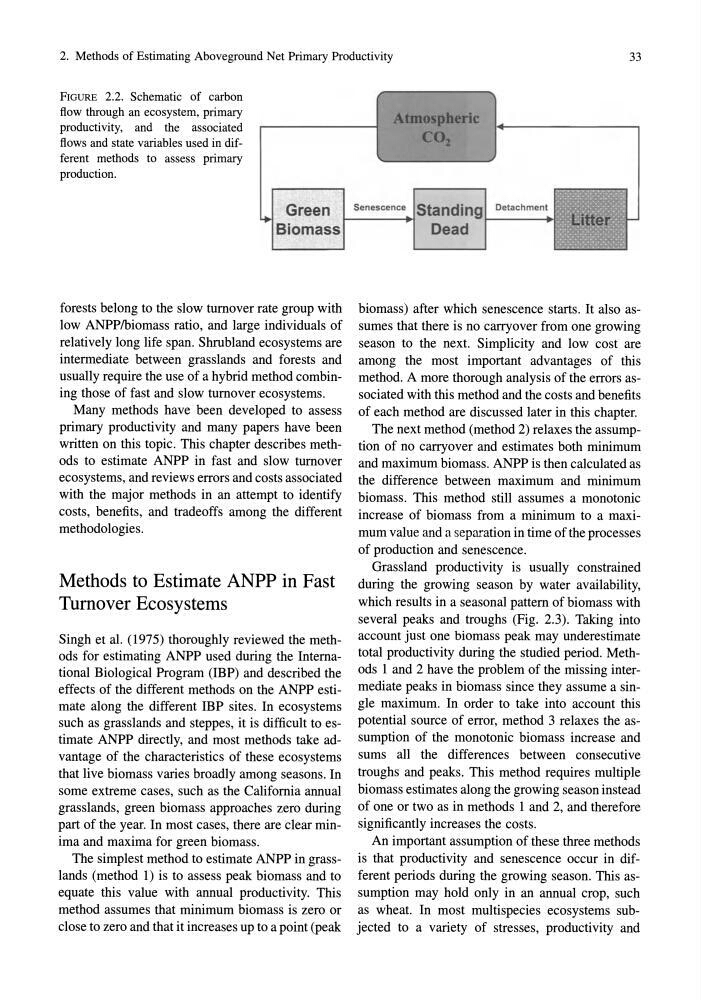
FIGURE 2.2. Schematic of carbon
flow through an ecosystem, primary
productivity, and the associated
flows and state variables used in different methods to assess primary
production.
Atmospheric
COl
Green I-s_en_e_sc_e_nc_e~Sta nd i n9 t-D_et_ac_hm _ e _n .. t
Biomass
Dead
forests belong to the slow turnover rate group with
low ANPPlbiomass ratio, and large individuals of
relatively long life span. Shrubland ecosystems are
intermediate between grasslands and forests and
usually require the use of a hybrid method combining those of fast and slow turnover ecosystems.
Many methods have been developed to assess
primary productivity and many papers have been
written on this topic. This chapter describes methods to estimate ANPP in fast and slow turnover
ecosystems, and reviews errors and costs associated
with the major methods in an attempt to identify
costs, benefits, and tradeoffs among the different
methodologies.
Methods to Estimate ANPP in Fast
Turnover Ecosystems
Singh et al. (1975) thoroughly reviewed the methods for estimating ANPP used during the International Biological Program (IBP) and described the
effects of the different methods on the ANPP estimate along the different IBP sites. In ecosystems
such as grasslands and steppes, it is difficult to estimate ANPP directly, and most methods take advantage of the characteristics of these ecosystems
that live biomass varies broadly among seasons. In
some extreme cases, such as the California annual
grasslands, green biomass approaches zero during
part of the year. In most cases, there are clear minima and maxima for green biomass.
The simplest method to estimate ANPP in grasslands (method 1) is to assess peak biomass and to
equate this value with annual productivity. This
method assumes that minimum biomass is zero or
close to zero and that it increases up to a point (peak
biomass) after which senescence starts. It also assumes that there is no carryover from one growing
season to the next. Simplicity and low cost are
among the most important advantages of this
method. A more thorough analysis of the errors associated with this method and the costs and benefits
of each method are discussed later in this chapter.
The next method (method 2) relaxes the assumption of no carryover and estimates both minimum
and maximum biomass. ANPP is then calculated as
the difference between maximum and minimum
biomass. This method still assumes a monotonic
increase of biomass from a minimum to a maximum value and a separation in time of the processes
of production and senescence.
Grassland productivity is usually constrained
during the growing season by water availability,
which results in a seasonal pattern of biomass with
several peaks and troughs (Fig. 2.3). Taking into
account just one biomass peak may underestimate
total productivity during the studied period. Methods 1 and 2 have the problem of the missing intermediate peaks in biomass since they assume a single maximum. In order to take into account this
potential source of error, method 3 relaxes the assumption of the monotonic biomass increase and
sums all the differences between consecutive
troughs and peaks. This method requires multiple
biomass estimates along the growing season instead
of one or two as in methods 1 and 2, and therefore
significantly increases the costs.
An important assumption of these three methods
is that productivity and senescence occur in different periods during the growing season. This assumption may hold only in an annual crop, such
as wheat. In most multispecies ecosystems subjected to a variety of stresses, productivity and
33
FIGURE 2.2. Schematic of carbon
flow through an ecosystem, primary
productivity, and the associated
flows and state variables used in different methods to assess primary
production.
Atmospheric
COl
Green I-s_en_e_sc_e_nc_e~Sta nd i n9 t-D_et_ac_hm _ e _n .. t
Biomass
Dead
forests belong to the slow turnover rate group with
low ANPPlbiomass ratio, and large individuals of
relatively long life span. Shrubland ecosystems are
intermediate between grasslands and forests and
usually require the use of a hybrid method combining those of fast and slow turnover ecosystems.
Many methods have been developed to assess
primary productivity and many papers have been
written on this topic. This chapter describes methods to estimate ANPP in fast and slow turnover
ecosystems, and reviews errors and costs associated
with the major methods in an attempt to identify
costs, benefits, and tradeoffs among the different
methodologies.
Methods to Estimate ANPP in Fast
Turnover Ecosystems
Singh et al. (1975) thoroughly reviewed the methods for estimating ANPP used during the International Biological Program (IBP) and described the
effects of the different methods on the ANPP estimate along the different IBP sites. In ecosystems
such as grasslands and steppes, it is difficult to estimate ANPP directly, and most methods take advantage of the characteristics of these ecosystems
that live biomass varies broadly among seasons. In
some extreme cases, such as the California annual
grasslands, green biomass approaches zero during
part of the year. In most cases, there are clear minima and maxima for green biomass.
The simplest method to estimate ANPP in grasslands (method 1) is to assess peak biomass and to
equate this value with annual productivity. This
method assumes that minimum biomass is zero or
close to zero and that it increases up to a point (peak
biomass) after which senescence starts. It also assumes that there is no carryover from one growing
season to the next. Simplicity and low cost are
among the most important advantages of this
method. A more thorough analysis of the errors associated with this method and the costs and benefits
of each method are discussed later in this chapter.
The next method (method 2) relaxes the assumption of no carryover and estimates both minimum
and maximum biomass. ANPP is then calculated as
the difference between maximum and minimum
biomass. This method still assumes a monotonic
increase of biomass from a minimum to a maximum value and a separation in time of the processes
of production and senescence.
Grassland productivity is usually constrained
during the growing season by water availability,
which results in a seasonal pattern of biomass with
several peaks and troughs (Fig. 2.3). Taking into
account just one biomass peak may underestimate
total productivity during the studied period. Methods 1 and 2 have the problem of the missing intermediate peaks in biomass since they assume a single maximum. In order to take into account this
potential source of error, method 3 relaxes the assumption of the monotonic biomass increase and
sums all the differences between consecutive
troughs and peaks. This method requires multiple
biomass estimates along the growing season instead
of one or two as in methods 1 and 2, and therefore
significantly increases the costs.
An important assumption of these three methods
is that productivity and senescence occur in different periods during the growing season. This assumption may hold only in an annual crop, such
as wheat. In most multispecies ecosystems subjected to a variety of stresses, productivity and