

34
III
l Q
E
o
iii
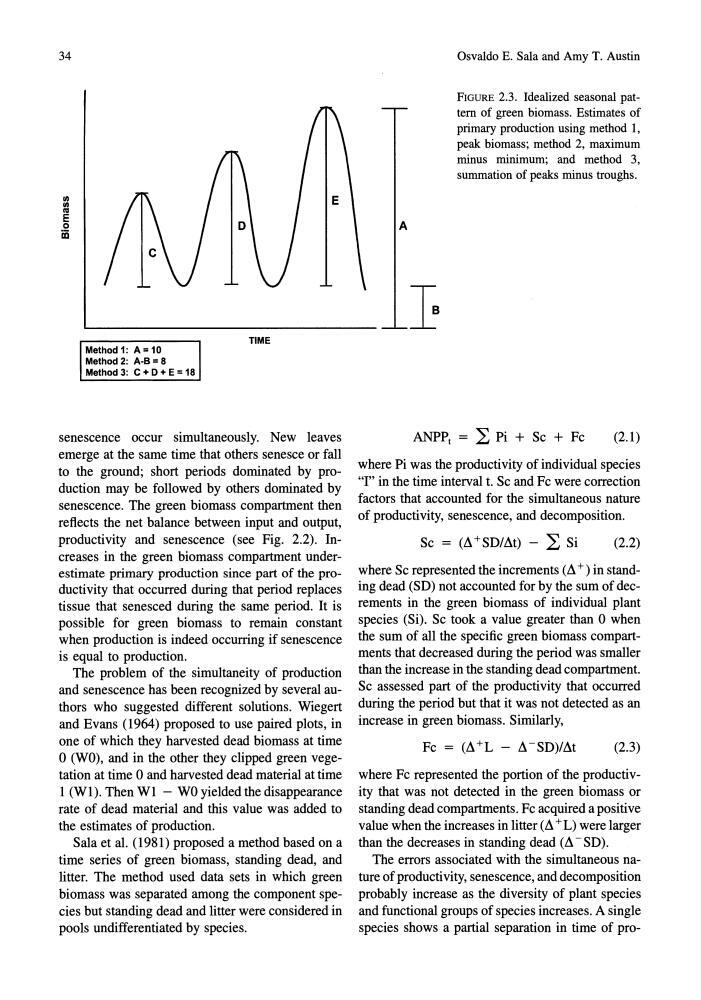
Method 1: A = 10
Method 2: A-B = 8
Method 3: C + 0 + E = 18
TIME
senescence occur simultaneously. New leaves
emerge at the same time that others senesce or fall
to the ground; short periods dominated by production may be followed by others dominated by
senescence. The green biomass compartment then
reflects the net balance between input and output,
productivity and senescence (see Fig. 2.2). Increases in the green biomass compartment underestimate primary production since part of the productivity that occurred during that period replaces
tissue that senesced during the same period. It is
possible for green biomass to remain constant
when production is indeed occurring if senescence
is equal to production.
The problem of the simultaneity of production
and senescence has been recognized by several authors who suggested different solutions. Wiegert
and Evans (1964) proposed to use paired plots, in
one of which they harvested dead biomass at time
o (WO), and in the other they clipped green vegetation at time 0 and harvested dead material at time
1 (WI). Then WI - WO yielded the disappearance
rate of dead material and this value was added to
the estimates of production.
Sala et al. (1981) proposed a method based on a
time series of green biomass, standing dead, and
litter. The method used data sets in which green
biomass was separated among the component species but standing dead and litter were considered in
pools undifferentiated by species.
A
Osvaldo E. Sala and Amy T. Austin
FIGURE 2.3. Idealized seasonal pattern of green biomass. Estimates of
primary production using method 1,
peak biomass; method 2, maximum
minus minimum; and method 3,
summation of peaks minus troughs.
ANPPt = L Pi + Sc + Fc (2.1)
where Pi was the productivity of individual species
"I" in the time interval 1. Sc and Fc were correction
factors that accounted for the simultaneous nature
of productivity, senescence, and decomposition.
Sc = (~+SD/~t) - L Si
(2.2)
where Sc represented the increments (~ +) in standing dead (SD) not accounted for by the sum of decrements in the green biomass of individual plant
species (Si). Sc took a value greater than 0 when
the sum of all the specific green biomass compartments that decreased during the period was smaller
than the increase in the standing dead compartment.
Sc assessed part of the productivity that occurred
during the period but that it was not detected as an
increase in green biomass. Similarly,
where Fc represented the portion of the productivity that was not detected in the green biomass or
standing dead compartments. Fc acquired a positive
value when the increases in litter (~ +L) were larger
than the decreases in standing dead (~ - SD).
The errors associated with the simultaneous nature of productivity, senescence, and decomposition
probably increase as the diversity of plant species
and functional groups of species increases. A single
species shows a partial separation in time of pro-
III
l Q
E
o
iii
Method 1: A = 10
Method 2: A-B = 8
Method 3: C + 0 + E = 18
TIME
senescence occur simultaneously. New leaves
emerge at the same time that others senesce or fall
to the ground; short periods dominated by production may be followed by others dominated by
senescence. The green biomass compartment then
reflects the net balance between input and output,
productivity and senescence (see Fig. 2.2). Increases in the green biomass compartment underestimate primary production since part of the productivity that occurred during that period replaces
tissue that senesced during the same period. It is
possible for green biomass to remain constant
when production is indeed occurring if senescence
is equal to production.
The problem of the simultaneity of production
and senescence has been recognized by several authors who suggested different solutions. Wiegert
and Evans (1964) proposed to use paired plots, in
one of which they harvested dead biomass at time
o (WO), and in the other they clipped green vegetation at time 0 and harvested dead material at time
1 (WI). Then WI - WO yielded the disappearance
rate of dead material and this value was added to
the estimates of production.
Sala et al. (1981) proposed a method based on a
time series of green biomass, standing dead, and
litter. The method used data sets in which green
biomass was separated among the component species but standing dead and litter were considered in
pools undifferentiated by species.
A
Osvaldo E. Sala and Amy T. Austin
FIGURE 2.3. Idealized seasonal pattern of green biomass. Estimates of
primary production using method 1,
peak biomass; method 2, maximum
minus minimum; and method 3,
summation of peaks minus troughs.
ANPPt = L Pi + Sc + Fc (2.1)
where Pi was the productivity of individual species
"I" in the time interval 1. Sc and Fc were correction
factors that accounted for the simultaneous nature
of productivity, senescence, and decomposition.
Sc = (~+SD/~t) - L Si
(2.2)
where Sc represented the increments (~ +) in standing dead (SD) not accounted for by the sum of decrements in the green biomass of individual plant
species (Si). Sc took a value greater than 0 when
the sum of all the specific green biomass compartments that decreased during the period was smaller
than the increase in the standing dead compartment.
Sc assessed part of the productivity that occurred
during the period but that it was not detected as an
increase in green biomass. Similarly,
where Fc represented the portion of the productivity that was not detected in the green biomass or
standing dead compartments. Fc acquired a positive
value when the increases in litter (~ +L) were larger
than the decreases in standing dead (~ - SD).
The errors associated with the simultaneous nature of productivity, senescence, and decomposition
probably increase as the diversity of plant species
and functional groups of species increases. A single
species shows a partial separation in time of pro-