

132
0
1.s
b ....
~
c
.2
'lii c
' e
:i c
.2
i
Mean Annual Precipitation (cm)
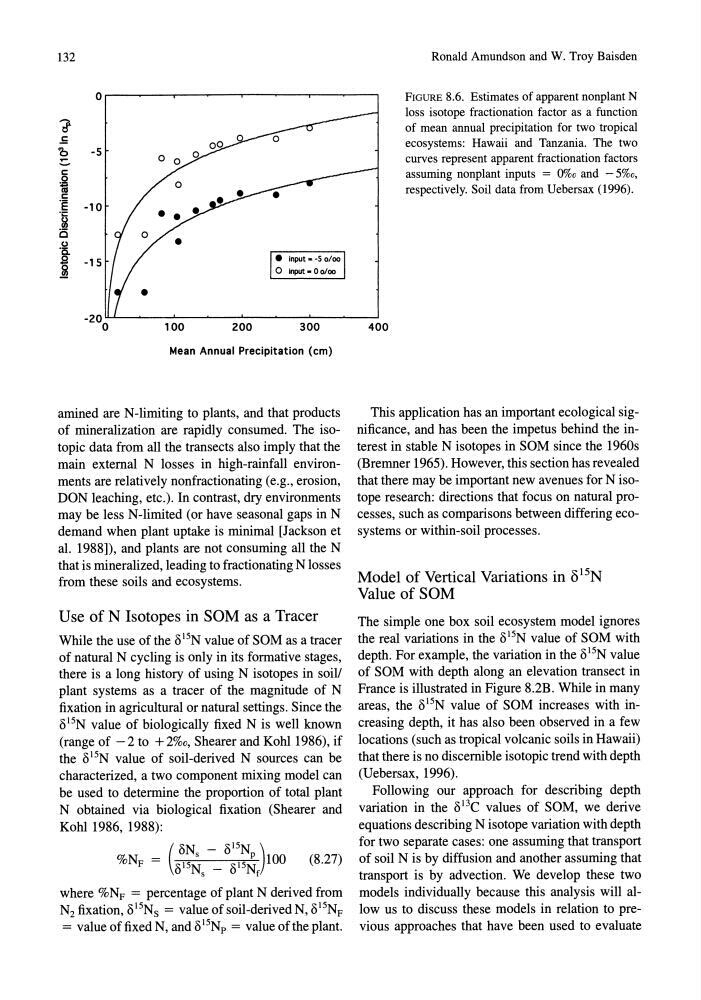
amined are N-limiting to plants, and that products
of mineralization are rapidly consumed. The isotopic data from all the transects also imply that the
main external N losses in high-rainfall environments are relatively nonfractionating (e.g., erosion,
DON leaching, etc.). In contrast, dry environments
may be less N-limited (or have seasonal gaps in N
demand when plant uptake is minimal [Jackson et
al. 1988]), and plants are not consuming all the N
that is mineralized, leading to fractionating N losses
from these soils and ecosystems.
Use of N Isotopes in SOM as a Tracer
While the use of the 015N value of SOM as a tracer
of natural N cycling is only in its formative stages,
there is a long history of using N isotopes in soil!
plant systems as a tracer of the magnitude of N
fixation in agricultural or natural settings. Since the
015N value of biologically fixed N is well known
(range of - 2 to + 2%0, Shearer and Kohl 1986), if
the 015N value of soil-derived N sources can be
characterized, a two component mixing model can
be used to determine the proportion of total plant
N obtained via biological fixation (Shearer and
Kohl 1986, 1988):
(
ON - 015N )
%NF = 015~s _ 015~f 100 (8.27)
where %N F = percentage of plant N derived from
N2 fixation, 015N s = value of soil-derived N, 015N F
= value of fixed N, and 015Np = value of the plant.
Ronald Amundson and W. Troy Baisden
FIGURE 8.6. Estimates of apparent nonplant N
loss isotope fractionation factor as a function
of mean annual precipitation for two tropical
ecosystems: Hawaii and Tanzania. The two
curves represent apparent fractionation factors
assuming nonplant inputs = 0%0 and - 5%0,
respectively. Soil data from Uebersax (1996).
This application has an important ecological significance, and has been the impetus behind the interest in stable N isotopes in SOM since the 1960s
(Bremner 1965). However, this section has revealed
that there may be important new avenues for N isotope research: directions that focus on natural processes, such as comparisons between differing ecosystems or within-soil processes.
Model of Vertical Variations in b 15 N
Value of SOM
The simple one box soil ecosystem model ignores
the real variations in the 015N value of SOM with
depth. For example, the variation in the 015N value
of SOM with depth along an elevation transect in
France is illustrated in Figure 8.2B. While in many
areas, the 015N value of SOM increases with increasing depth, it has also been observed in a few
locations (such as tropical volcanic soils in Hawaii)
that there is no discernible isotopic trend with depth
(Uebersax, 1996).
Following our approach for describing depth
variation in the ol3e values of SOM, we derive
equations describing N isotope variation with depth
for two separate cases: one assuming that transport
of soil N is by diffusion and another assuming that
transport is by advection. We develop these two
models individually because this analysis will allow us to discuss these models in relation to previous approaches that have been used to evaluate
0
1.s
b ....
~
c
.2
'lii c
' e
:i c
.2
i
Mean Annual Precipitation (cm)
amined are N-limiting to plants, and that products
of mineralization are rapidly consumed. The isotopic data from all the transects also imply that the
main external N losses in high-rainfall environments are relatively nonfractionating (e.g., erosion,
DON leaching, etc.). In contrast, dry environments
may be less N-limited (or have seasonal gaps in N
demand when plant uptake is minimal [Jackson et
al. 1988]), and plants are not consuming all the N
that is mineralized, leading to fractionating N losses
from these soils and ecosystems.
Use of N Isotopes in SOM as a Tracer
While the use of the 015N value of SOM as a tracer
of natural N cycling is only in its formative stages,
there is a long history of using N isotopes in soil!
plant systems as a tracer of the magnitude of N
fixation in agricultural or natural settings. Since the
015N value of biologically fixed N is well known
(range of - 2 to + 2%0, Shearer and Kohl 1986), if
the 015N value of soil-derived N sources can be
characterized, a two component mixing model can
be used to determine the proportion of total plant
N obtained via biological fixation (Shearer and
Kohl 1986, 1988):
(
ON - 015N )
%NF = 015~s _ 015~f 100 (8.27)
where %N F = percentage of plant N derived from
N2 fixation, 015N s = value of soil-derived N, 015N F
= value of fixed N, and 015Np = value of the plant.
Ronald Amundson and W. Troy Baisden
FIGURE 8.6. Estimates of apparent nonplant N
loss isotope fractionation factor as a function
of mean annual precipitation for two tropical
ecosystems: Hawaii and Tanzania. The two
curves represent apparent fractionation factors
assuming nonplant inputs = 0%0 and - 5%0,
respectively. Soil data from Uebersax (1996).
This application has an important ecological significance, and has been the impetus behind the interest in stable N isotopes in SOM since the 1960s
(Bremner 1965). However, this section has revealed
that there may be important new avenues for N isotope research: directions that focus on natural processes, such as comparisons between differing ecosystems or within-soil processes.
Model of Vertical Variations in b 15 N
Value of SOM
The simple one box soil ecosystem model ignores
the real variations in the 015N value of SOM with
depth. For example, the variation in the 015N value
of SOM with depth along an elevation transect in
France is illustrated in Figure 8.2B. While in many
areas, the 015N value of SOM increases with increasing depth, it has also been observed in a few
locations (such as tropical volcanic soils in Hawaii)
that there is no discernible isotopic trend with depth
(Uebersax, 1996).
Following our approach for describing depth
variation in the ol3e values of SOM, we derive
equations describing N isotope variation with depth
for two separate cases: one assuming that transport
of soil N is by diffusion and another assuming that
transport is by advection. We develop these two
models individually because this analysis will allow us to discuss these models in relation to previous approaches that have been used to evaluate