

8. Stable Isotope Tracers and Mathematical Models in Soil Organic Matter Studies
131
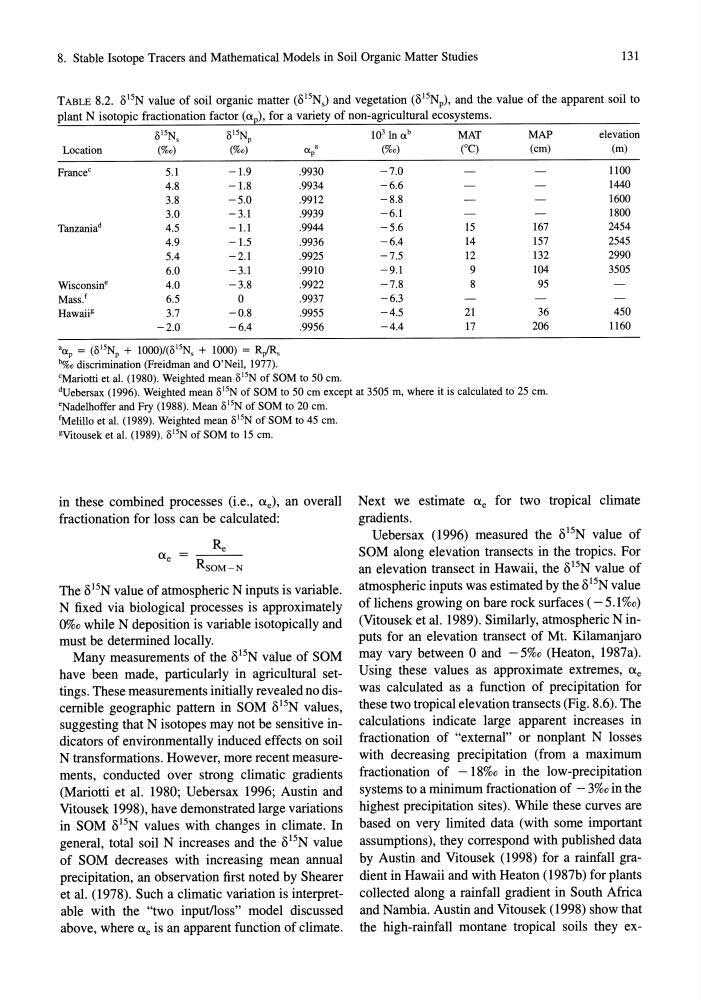
TABLE 8.2. 1) 15 N value of soil organic matter (1) 15 N s ) and vegetation (1) 15 Np), and the value of the apparent soil to
plant N isotopic fractionation factor (O:p), for a variety of non-agricultural ecosystems.
1) 15 N s
1) 15Np
Location
(%0)
(%0)
France c
5.1
-1.9
4.8
-1.8
3.8
-5.0
3.0
-3.1
Tanzania d
4.5
-1.1
4.9
-1.5
5.4
-2.1
6.0
-3.1
Wisconsin"
4.0
-3.8
Mass. f
6.5
0
Hawaii g
3.7
-0.8
-2.0
-6.4
aap = (1) 15 Np + 1000)/(1) 15 Ns + 1000) = R/Rs
~o discrimination (Freidman and O'Neil, 1977).
aa p
.9930
.9934
.9912
.9939
.9944
.9936
.9925
.9910
.9922
.9937
.9955
.9956
"Mariotti et al. (1980). Weighted mean 1) 15 N of SOM to 50 cm.
10 3 In a b
MAT
MAP
elevation
(%0)
("C)
(cm)
(m)
-7.0
1100
-6.6
1440
-8.8
1600
-6.1
1800
-5.6
15
167
2454
-6.4
14
157
2545
-7.5
12
132
2990
-9.1
9
104
3505
-7.8
8
95
-6.3
-4.5
21
36
450
-4.4
17
206
1160
dUebersax (1996). Weighted mean 1) 15 N of SOM to 50 cm except at 3505 m, where it is calculated to 25 cm.
"Nadelhoffer and Fry (1988). Mean 1) 15 N of SOM to 20 cm.
lMelillo et al. (1989). Weighted mean 1) 15 N of SOM to 45 cm.
gVitousek et al. (1989). 1) 15 N of SOM to 15 cm.
in these combined processes (i.e.,
e
R SOM - N
The (5 15 N value of atmospheric N inputs is variable.
N fixed via biological processes is approximately
0%0 while N deposition is variable isotopically and
must be determined locally.
Many measurements of the (5 15 N value of SOM
have been made, particularly in agricultural settings. These measurements initially revealed no discernible geographic pattern in SOM (5 15 N values,
suggesting that N isotopes may not be sensitive indicators of environmentally induced effects on soil
N transformations. However, more recent measurements, conducted over strong climatic gradients
(Mariotti et al. 1980; Uebersax 1996; Austin and
Vitousek 1998), have demonstrated large variations
in SOM (5 15 N values with changes in climate. In
general, total soil N increases and the (5 15 N value
of SOM decreases with increasing mean annual
precipitation, an observation first noted by Shearer
et al. (1978). Such a climatic variation is interpretable with the "two inputlloss" model discussed
above, where
Uebersax (1996) measured the (5 15 N value of
SOM along elevation transects in the tropics. For
an elevation transect in Hawaii, the (5 15 N value of
atmospheric inputs was estimated by the (5 15 N value
of lichens growing on bare rock surfaces ( - 5.1 %o)
(Vitousek et al. 1989). Similarly, atmospheric N inputs for an elevation transect of Mt. Kilamanjaro
may vary between 0 and - 5%0 (Heaton, 1987a).
Using these values as approximate extremes,
these two tropical elevation transects (Fig. 8.6). The
calculations indicate large apparent increases in
fractionation of "external" or nonplant N losses
with decreasing precipitation (from a maximum
fractionation of -18%0 in the low-precipitation
systems to a minimum fractionation of - 3%0 in the
highest precipitation sites). While these curves are
based on very limited data (with some important
assumptions), they correspond with published data
by Austin and Vitousek (1998) for a rainfall gradient in Hawaii and with Heaton (1987b) for plants
collected along a rainfall gradient in South Africa
and Nambia. Austin and Vitousek (1998) show that
the high-rainfall montane tropical soils they ex-
131
TABLE 8.2. 1) 15 N value of soil organic matter (1) 15 N s ) and vegetation (1) 15 Np), and the value of the apparent soil to
plant N isotopic fractionation factor (O:p), for a variety of non-agricultural ecosystems.
1) 15 N s
1) 15Np
Location
(%0)
(%0)
France c
5.1
-1.9
4.8
-1.8
3.8
-5.0
3.0
-3.1
Tanzania d
4.5
-1.1
4.9
-1.5
5.4
-2.1
6.0
-3.1
Wisconsin"
4.0
-3.8
Mass. f
6.5
0
Hawaii g
3.7
-0.8
-2.0
-6.4
aap = (1) 15 Np + 1000)/(1) 15 Ns + 1000) = R/Rs
~o discrimination (Freidman and O'Neil, 1977).
aa p
.9930
.9934
.9912
.9939
.9944
.9936
.9925
.9910
.9922
.9937
.9955
.9956
"Mariotti et al. (1980). Weighted mean 1) 15 N of SOM to 50 cm.
10 3 In a b
MAT
MAP
elevation
(%0)
("C)
(cm)
(m)
-7.0
1100
-6.6
1440
-8.8
1600
-6.1
1800
-5.6
15
167
2454
-6.4
14
157
2545
-7.5
12
132
2990
-9.1
9
104
3505
-7.8
8
95
-6.3
-4.5
21
36
450
-4.4
17
206
1160
dUebersax (1996). Weighted mean 1) 15 N of SOM to 50 cm except at 3505 m, where it is calculated to 25 cm.
"Nadelhoffer and Fry (1988). Mean 1) 15 N of SOM to 20 cm.
lMelillo et al. (1989). Weighted mean 1) 15 N of SOM to 45 cm.
gVitousek et al. (1989). 1) 15 N of SOM to 15 cm.
in these combined processes (i.e.,
e
R SOM - N
The (5 15 N value of atmospheric N inputs is variable.
N fixed via biological processes is approximately
0%0 while N deposition is variable isotopically and
must be determined locally.
Many measurements of the (5 15 N value of SOM
have been made, particularly in agricultural settings. These measurements initially revealed no discernible geographic pattern in SOM (5 15 N values,
suggesting that N isotopes may not be sensitive indicators of environmentally induced effects on soil
N transformations. However, more recent measurements, conducted over strong climatic gradients
(Mariotti et al. 1980; Uebersax 1996; Austin and
Vitousek 1998), have demonstrated large variations
in SOM (5 15 N values with changes in climate. In
general, total soil N increases and the (5 15 N value
of SOM decreases with increasing mean annual
precipitation, an observation first noted by Shearer
et al. (1978). Such a climatic variation is interpretable with the "two inputlloss" model discussed
above, where
Uebersax (1996) measured the (5 15 N value of
SOM along elevation transects in the tropics. For
an elevation transect in Hawaii, the (5 15 N value of
atmospheric inputs was estimated by the (5 15 N value
of lichens growing on bare rock surfaces ( - 5.1 %o)
(Vitousek et al. 1989). Similarly, atmospheric N inputs for an elevation transect of Mt. Kilamanjaro
may vary between 0 and - 5%0 (Heaton, 1987a).
Using these values as approximate extremes,
these two tropical elevation transects (Fig. 8.6). The
calculations indicate large apparent increases in
fractionation of "external" or nonplant N losses
with decreasing precipitation (from a maximum
fractionation of -18%0 in the low-precipitation
systems to a minimum fractionation of - 3%0 in the
highest precipitation sites). While these curves are
based on very limited data (with some important
assumptions), they correspond with published data
by Austin and Vitousek (1998) for a rainfall gradient in Hawaii and with Heaton (1987b) for plants
collected along a rainfall gradient in South Africa
and Nambia. Austin and Vitousek (1998) show that
the high-rainfall montane tropical soils they ex-