

130
gresses, the net effect of the fractionating losses
will become magnified and reflected in the remaining SOM pool.
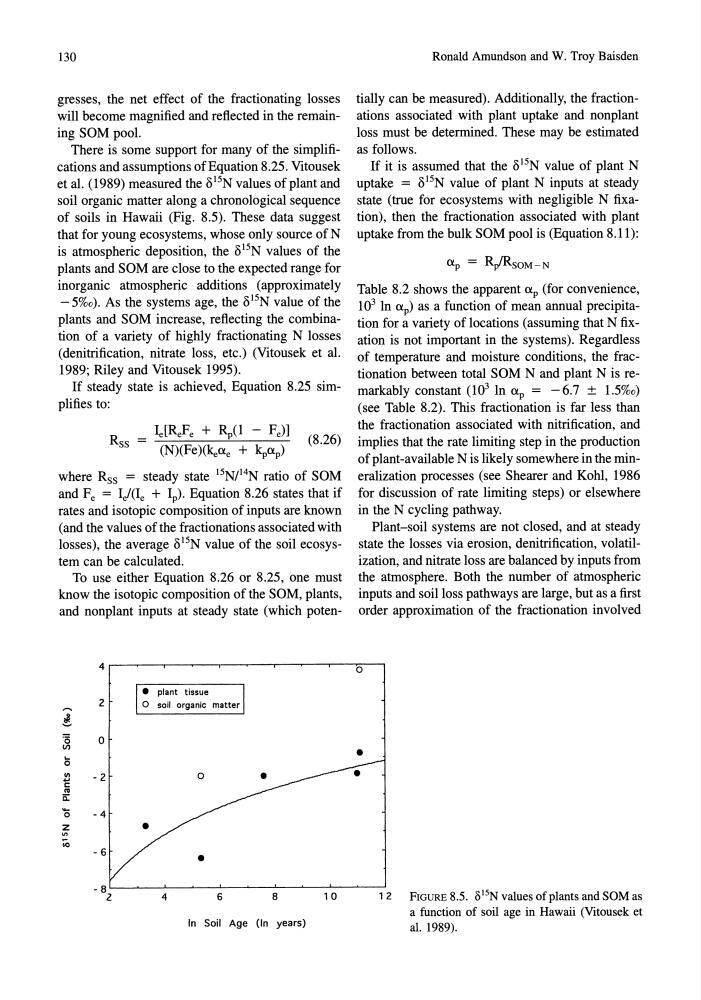
There is some support for many of the simplifications and assumptions of Equation 8.25. Vitousek
et al. (1989) measured the 0 15 N values of plant and
soil organic matter along a chronological sequence
of soils in Hawaii (Fig. 8.5). These data suggest
that for young ecosystems, whose only source of N
is atmospheric deposition, the 0 15 N values of the
plants and SOM are close to the expected range for
inorganic atmospheric additions (approximately
- 5%0). As the systems age, the 0 15 N value of the
plants and SOM increase, reflecting the combination of a variety of highly fractionating N losses
(denitrification, nitrate loss, etc.) (Vitousek et al.
1989; Riley and Vitousek 1995).
If steady state is achieved, Equation 8.25 simplifies to:
Rss = I"[R,,Fe + ~(1 - Fe)] (8.26)
(N)(Fe)(ke
and Fe = IJ{le + ~). Equation 8.26 states that if
rates and isotopic composition of inputs are known
(and the values of the fractionations associated with
losses), the average 0 15 N value of the soil ecosystem can be calculated.
To use either Equation 8.26 or 8.25, one must
know the isotopic composition of the SOM, plants,
and nonplant inputs at steady state (which poten4
• plant tissue
.....
2
o soil organic matter
t
·0
0
en
..
0
., - 2
... C
IV
c::
.....
-4
0
z
•
III
;0
•
4
6
8
10
In Soil Age (In years)
Ronald Amundson and W. Troy Baisden
tially can be measured). Additionally, the fractionations associated with plant uptake and nonplant
loss must be determined. These may be estimated
as follows.
If it is assumed that the 0 15 N value of plant N
uptake = 0 15 N value of plant N inputs at steady
state (true for ecosystems with negligible N fixation), then the fractionation associated with plant
uptake from the bulk SOM pool is (Equation 8.11):
the fractionation associated with nitrification, and
implies that the rate limiting step in the production
of plant-available N is likely somewhere in the mineralization processes (see Shearer and Kohl, 1986
for discussion of rate limiting steps) or elsewhere
in the N cycling pathway.
Plant-soil systems are not closed, and at steady
state the losses via erosion, denitrification, volatilization, and nitrate loss are balanced by inputs from
the atmosphere. Both the number of atmospheric
inputs and soil loss pathways are large, but as a first
order approximation of the fractionation involved
o
•
12
FIGURE 8.5. 0 15 N values of plants and SOM as
a function of soil age in Hawaii (Vitousek et
al. 1989).
gresses, the net effect of the fractionating losses
will become magnified and reflected in the remaining SOM pool.
There is some support for many of the simplifications and assumptions of Equation 8.25. Vitousek
et al. (1989) measured the 0 15 N values of plant and
soil organic matter along a chronological sequence
of soils in Hawaii (Fig. 8.5). These data suggest
that for young ecosystems, whose only source of N
is atmospheric deposition, the 0 15 N values of the
plants and SOM are close to the expected range for
inorganic atmospheric additions (approximately
- 5%0). As the systems age, the 0 15 N value of the
plants and SOM increase, reflecting the combination of a variety of highly fractionating N losses
(denitrification, nitrate loss, etc.) (Vitousek et al.
1989; Riley and Vitousek 1995).
If steady state is achieved, Equation 8.25 simplifies to:
Rss = I"[R,,Fe + ~(1 - Fe)] (8.26)
(N)(Fe)(ke
and Fe = IJ{le + ~). Equation 8.26 states that if
rates and isotopic composition of inputs are known
(and the values of the fractionations associated with
losses), the average 0 15 N value of the soil ecosystem can be calculated.
To use either Equation 8.26 or 8.25, one must
know the isotopic composition of the SOM, plants,
and nonplant inputs at steady state (which poten4
• plant tissue
.....
2
o soil organic matter
t
·0
0
en
..
0
., - 2
... C
IV
c::
.....
-4
0
z
•
III
;0
•
4
6
8
10
In Soil Age (In years)
Ronald Amundson and W. Troy Baisden
tially can be measured). Additionally, the fractionations associated with plant uptake and nonplant
loss must be determined. These may be estimated
as follows.
If it is assumed that the 0 15 N value of plant N
uptake = 0 15 N value of plant N inputs at steady
state (true for ecosystems with negligible N fixation), then the fractionation associated with plant
uptake from the bulk SOM pool is (Equation 8.11):
the fractionation associated with nitrification, and
implies that the rate limiting step in the production
of plant-available N is likely somewhere in the mineralization processes (see Shearer and Kohl, 1986
for discussion of rate limiting steps) or elsewhere
in the N cycling pathway.
Plant-soil systems are not closed, and at steady
state the losses via erosion, denitrification, volatilization, and nitrate loss are balanced by inputs from
the atmosphere. Both the number of atmospheric
inputs and soil loss pathways are large, but as a first
order approximation of the fractionation involved
o
•
12
FIGURE 8.5. 0 15 N values of plants and SOM as
a function of soil age in Hawaii (Vitousek et
al. 1989).