

68
S. Casini et aI.
Table 4. Range of concentrations (ng/g fresh weight) of organochlorines in muscle of Liza aurata sampled in 1995 at
Fogliano and Caprolace lake
Lake
(n)
Fogliano (19)
Caprolace (20)
RCB
0.005-0.35
0.01-1.97
I DDT
2.0-32.7
1.5-31.5
IpCB
10-154
3-150
Fogliano lake. The DDTs concentration, were
higher than in 1994. The PCB levels were higher
in fish from Fogliano than Caprolace lake.
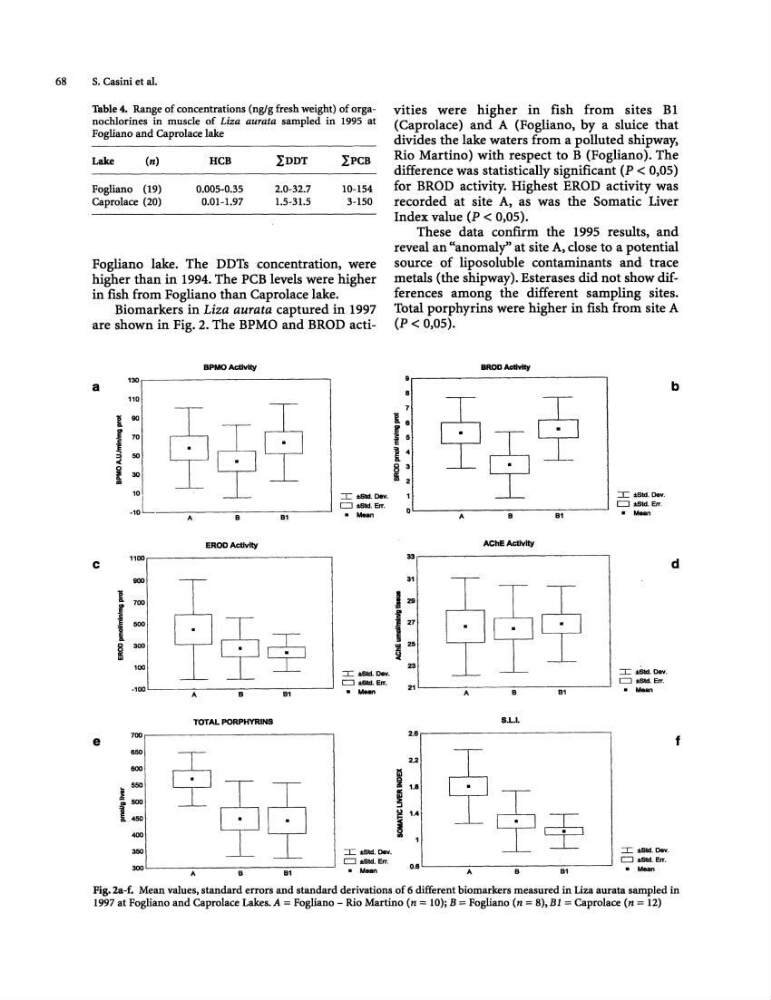
Biomarkers in Liza aurata captured in 1997
are shown in Fig. 2. The BPMO and BROD actia
110
c
I 700
I
~
e
ERODActivillf
T
TOTAL PORPHYRINS
:::c ..std. Ow.
o _.EIr.
• Mean
:::c ..std. DeY.
o :tSId. EIr.
• Mean
:::r: lo8td. Day.
o ..sid. Err.
• Mean
vities were higher in fish from sites B 1
(Caprolace) and A (Fogliano, by a sluice that
divides the lake waters from a polluted shipway,
Rio Martino) with respect to B (Fogliano). The
difference was statistically significant (P < 0,05)
for BROD activity. Highest EROD activity was
recorded at site A. as was the Somatic Liver
Index value (P < 0,05).
These data confirm the 1995 results, and
reveal an "anomaly" at site A, close to a potential
source of liposoluble contaminants and trace
metals (the shipway). Esterases did not show differences among the different sampling sites.
Total porphyrins were higher in fish from site A
(P < 0,05).
9r-------------------------,
8
7
Is
tl'
! S
14
8 3
Ili 2
Q~-----A------~B----~a~1----~
AChE ActIvity
8.1...1.
2.6.-----------------------------,
2.2
0.11 L------:-A---~8::-------::81;-------'
:::c ..sid. Dev.
c:J _.Err.
• Mean
:::c :tSId. DeY.
CJ :tSId. Err.
. -.
:::c ..std. Dav.
CJ :tSId. En.
a Mean
b
d
f
Fig. :la-f. Mean values, standard errors and standard derivations of 6 different biomarkers measured in Liza aurata sampled in
1997 at Fogliano and Caprolace Lakes. A = Fogliano - Rio Martino (n = 10); B == Fogliano (n == 8), Bl = Caprolace (n = 12)
S. Casini et aI.
Table 4. Range of concentrations (ng/g fresh weight) of organochlorines in muscle of Liza aurata sampled in 1995 at
Fogliano and Caprolace lake
Lake
(n)
Fogliano (19)
Caprolace (20)
RCB
0.005-0.35
0.01-1.97
I DDT
2.0-32.7
1.5-31.5
IpCB
10-154
3-150
Fogliano lake. The DDTs concentration, were
higher than in 1994. The PCB levels were higher
in fish from Fogliano than Caprolace lake.
Biomarkers in Liza aurata captured in 1997
are shown in Fig. 2. The BPMO and BROD actia
110
c
I 700
I
~
e
ERODActivillf
T
TOTAL PORPHYRINS
:::c ..std. Ow.
o _.EIr.
• Mean
:::c ..std. DeY.
o :tSId. EIr.
• Mean
:::r: lo8td. Day.
o ..sid. Err.
• Mean
vities were higher in fish from sites B 1
(Caprolace) and A (Fogliano, by a sluice that
divides the lake waters from a polluted shipway,
Rio Martino) with respect to B (Fogliano). The
difference was statistically significant (P < 0,05)
for BROD activity. Highest EROD activity was
recorded at site A. as was the Somatic Liver
Index value (P < 0,05).
These data confirm the 1995 results, and
reveal an "anomaly" at site A, close to a potential
source of liposoluble contaminants and trace
metals (the shipway). Esterases did not show differences among the different sampling sites.
Total porphyrins were higher in fish from site A
(P < 0,05).
9r-------------------------,
8
7
Is
tl'
! S
14
8 3
Ili 2
Q~-----A------~B----~a~1----~
AChE ActIvity
8.1...1.
2.6.-----------------------------,
2.2
0.11 L------:-A---~8::-------::81;-------'
:::c ..sid. Dev.
c:J _.Err.
• Mean
:::c :tSId. DeY.
CJ :tSId. Err.
. -.
:::c ..std. Dav.
CJ :tSId. En.
a Mean
b
d
f
Fig. :la-f. Mean values, standard errors and standard derivations of 6 different biomarkers measured in Liza aurata sampled in
1997 at Fogliano and Caprolace Lakes. A = Fogliano - Rio Martino (n = 10); B == Fogliano (n == 8), Bl = Caprolace (n = 12)