

Fish and Bioindicators in the Pontine Lakes
67
Table 3. Range of concentrations (ng/g fresh weight) of organochlorines in muscle of several fish species sampled in 1994 at
Fogliano lake
Species (n)
Length (em)
PCBs
Solea vulgaris (5)
23.0-23.5
3-674
Liza aurata (4)
22.0-23.0
12-23
Liza saliens (3)
17.0-23.0
60-150
Liza ramada (3)
16.4-19.8
11-50
MugU cephalus (5)
38.5-44.0
7-31
Gobius niger (2)
13.8-14.0
80-240
were higher in Gobius niger (1.3 Jlglg), presumably due to the benthic habitat of this species.
Organochlorine analysis in muscle (Table 3)
revealed hexachlorobenzene (HCB), lindane,
pp'DDT and its metabolites and several PCBs
congeners. The HCB, DDT and lindane concentrations were low. Interestingly, a specimen of
Salea vulgaris had a concentration of 674 ng/g
f. w., similar to the levels typical of heavily contaminated areas by PCBs. Similar high levels were
also found in a specimen of Liza saliens and one
of Gobius niger.
The results of biomarker studies in speda 280
240
11
Ii. 200
~
i 160
1 120
I • I
f 80
i 40
~ 0
=_0...
-40
CJ dbtEPf.
C&prolace
Fogliano
.......
C
0.28
0.22
f 0.18
~ 0.14
~
.. ..,
li 0.1
0.06
g
I
•
1
= ._c...
0.02
c::J _.Err.
C&prolace
Fogllano
.......
pP'DDE
DDT
HCB
HCH
0.3-156
0.5-177
0.01-1.00
0.005-2.000
0.5-2.5
0.6-2.8
0.02-0.05
0.005-0.030
1.0-1.5
2.0-4.0
0.02-0.03
0.010-0.080
0.6-4.9
0.8-4.8
0.05-0.07
0.010-0.020
0.3-1.2
0.4-1.4
0.01-0.04
0.003-0.020
0.2-5.6
0.4-9.7
0.10-1.20
0.030-0.400
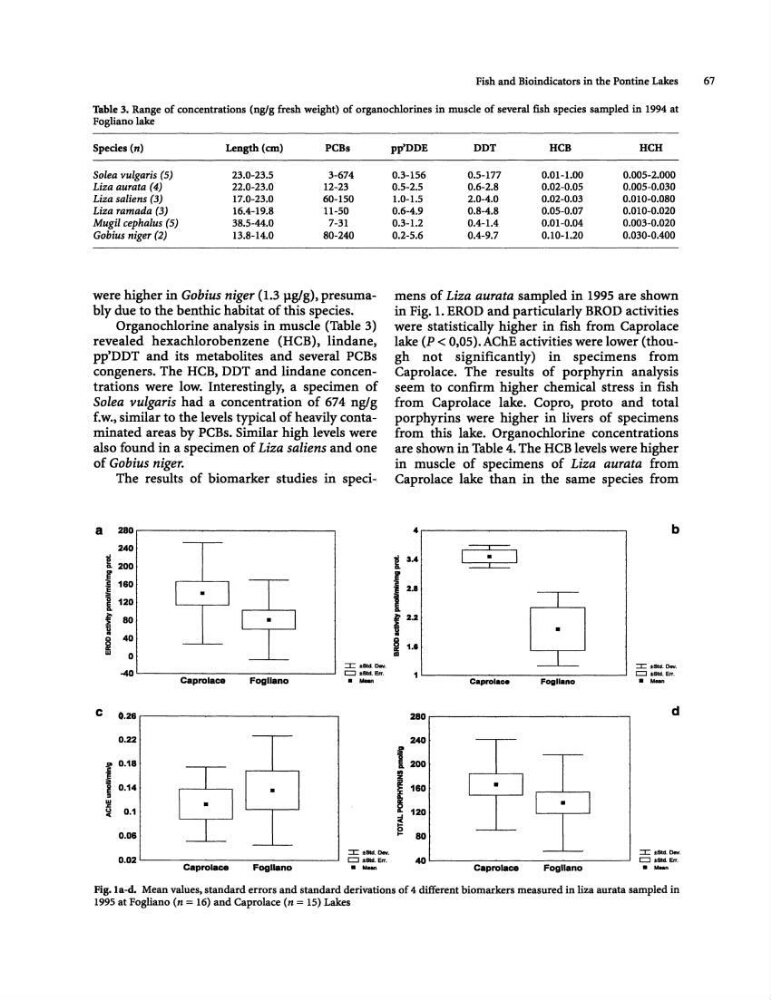
mens of Liza au rata sampled in 1995 are shown
in Fig. 1. EROD and particularly BRaD activities
were statistically higher in fish from Caprolace
lake (P < 0,05). AChE activities were lower (though not significantly) in specimens from
Caprolace. The results of porphyrin analysis
seem to confirm higher chemical stress in fish
from Caprolace lake. Copro, proto and total
porphyrins were higher in livers of specimens
from this lake. Organochlorine concentrations
are shown in Table 4. The HCB levels were higher
in muscle of specimens of Liza aurata from
Caprolace lake than in the same species from
4
b
i3.4
f
iu
g
1
12.2
§ 1.11
CD
=-""".
1
=_.Err.
C8pro1ace
FOIJllano
• M_n
280
d
240
f 200
I
160
I • I
l
120
... 80
=.-0 ...
40
= _.err.
C&prolace
Fogllano
. .....
Fig.la-d. Mean values, standard errors and standard derivations of 4 different biomarkers measured in liza aurata sampled in
1995 at Fogliano (n = 16) and Caprolace (n = 15) Lakes
67
Table 3. Range of concentrations (ng/g fresh weight) of organochlorines in muscle of several fish species sampled in 1994 at
Fogliano lake
Species (n)
Length (em)
PCBs
Solea vulgaris (5)
23.0-23.5
3-674
Liza aurata (4)
22.0-23.0
12-23
Liza saliens (3)
17.0-23.0
60-150
Liza ramada (3)
16.4-19.8
11-50
MugU cephalus (5)
38.5-44.0
7-31
Gobius niger (2)
13.8-14.0
80-240
were higher in Gobius niger (1.3 Jlglg), presumably due to the benthic habitat of this species.
Organochlorine analysis in muscle (Table 3)
revealed hexachlorobenzene (HCB), lindane,
pp'DDT and its metabolites and several PCBs
congeners. The HCB, DDT and lindane concentrations were low. Interestingly, a specimen of
Salea vulgaris had a concentration of 674 ng/g
f. w., similar to the levels typical of heavily contaminated areas by PCBs. Similar high levels were
also found in a specimen of Liza saliens and one
of Gobius niger.
The results of biomarker studies in speda 280
240
11
Ii. 200
~
i 160
1 120
I • I
f 80
i 40
~ 0
=_0...
-40
CJ dbtEPf.
C&prolace
Fogliano
.......
C
0.28
0.22
f 0.18
~ 0.14
~
.. ..,
li 0.1
0.06
g
I
•
1
= ._c...
0.02
c::J _.Err.
C&prolace
Fogllano
.......
pP'DDE
DDT
HCB
HCH
0.3-156
0.5-177
0.01-1.00
0.005-2.000
0.5-2.5
0.6-2.8
0.02-0.05
0.005-0.030
1.0-1.5
2.0-4.0
0.02-0.03
0.010-0.080
0.6-4.9
0.8-4.8
0.05-0.07
0.010-0.020
0.3-1.2
0.4-1.4
0.01-0.04
0.003-0.020
0.2-5.6
0.4-9.7
0.10-1.20
0.030-0.400
mens of Liza au rata sampled in 1995 are shown
in Fig. 1. EROD and particularly BRaD activities
were statistically higher in fish from Caprolace
lake (P < 0,05). AChE activities were lower (though not significantly) in specimens from
Caprolace. The results of porphyrin analysis
seem to confirm higher chemical stress in fish
from Caprolace lake. Copro, proto and total
porphyrins were higher in livers of specimens
from this lake. Organochlorine concentrations
are shown in Table 4. The HCB levels were higher
in muscle of specimens of Liza aurata from
Caprolace lake than in the same species from
4
b
i3.4
f
iu
g
1
12.2
§ 1.11
CD
=-""".
1
=_.Err.
C8pro1ace
FOIJllano
• M_n
280
d
240
f 200
I
160
I • I
l
120
... 80
=.-0 ...
40
= _.err.
C&prolace
Fogllano
. .....
Fig.la-d. Mean values, standard errors and standard derivations of 4 different biomarkers measured in liza aurata sampled in
1995 at Fogliano (n = 16) and Caprolace (n = 15) Lakes