

66
S. Casini et al.
ramada, MugU cephalus. Gobius niger, and Solea
vulgaris were sampled in Fogliano lake. In July
1995 specimens of Liza au rata were sampled in
Fogliano and Caprolace lakes (midle of the lakes).
In June 1997 specimens of Liza aurata were sampled in two sites in Fogliano lake: A (by a sluice
that divides the lakes waters from a polluted
shipway, Rio Martino) and B (midle of the lake);
and one in Caprolace lake (midle of the lake, Bl).
All specimens were dissected immediately after
sacrifice the livers and brains were kept in liquid
nitrogen and muscle at -20°C until analysis.
After separation of the microsomal fraction,
the following MFO activities were evaluated:
ethoxyresorufin-o-deethylase (EROD) and
benzyloxyresorufin-o-deethylase (BROD) by the
method of Lubet et al. (1985); benzopyrenemono-oxygenase (BPMO) by the method of
Kurelec et al. (1977). Acetylcholinesterase activity was measured in brain homogenate by the
method of Ellman (1961).
Porphyrins (copro, uro and protoporphyrins) were measured in the liver by the method of
Grandchamp et al. (1980). Somatic Liver Index
[S.L.I. = (liver weighttbody weight) x 100] was
calculated for each specimen.
Qualitative and quantitative evaluation of the
levels of hexachlorobenzene, total DDTs and
total PCBs was performed in muscle by gas chromatography, using a Perkin-Elmer Autosystem
model equipped with Ni63 electron capture
detector and type SBP-5 (Supelco) bonded-phase
fused silica capillary columns.
Trace elements (Cd, Ph, Se, Zn, Cu, Cr, Ni»
were detected by plasma emission spectrometry
according to the method of Broekaert (1994),
mercury by flow injection mercury system by the
method of Stoeppler and Backhaus (1978).
Results
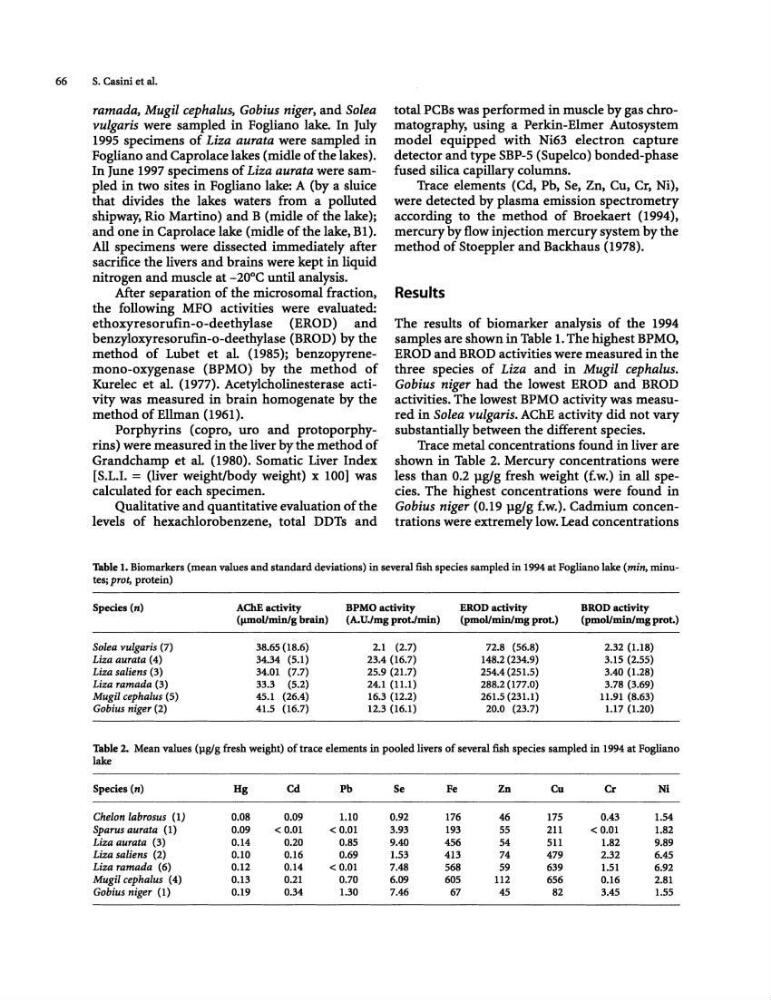
The results of biomarker analysis of the 1994
samples are shown in Table 1. The highest BPMO.
EROD and BROD activities were measured in the
three species of Liza and in MugU cephalus.
Gobius niger had the lowest EROD and BROD
activities. The lowest BPMO activity was measured in Solea vulgaris. AChE activity did not vary
substantially between the different species.
Trace metal concentrations found in liver are
shown in Table 2. Mercury concentrations were
less than 0.2 p.g/g fresh weight (f.w.) in all species. The highest concentrations were found in
Gobius niger (0.19 p.g/g f.w.). Cadmium concentrations were extremely low. Lead concentrations
Table 1. Biomarkers (mean values and standard deviations) in several fish species sampled in 1994 at Fogliano lake (min, minutes; prot, protein)
Spedes(n)
AChE activity
BPMO activity
EROD activity
BROD activity
(J1IDDlImin/g brain)
(A.UJmg protJmin)
(pmol/minlmg prot.)
(pmolJminJmg prot.)
Solea vulgaris (7)
38.65 (18.6)
2.1 (2.7)
72.8 (56.8)
2.32 (Ll8)
Liza aurata (4)
34.34 (5.1)
23.4 (16.7)
148.2 (234.9)
3.15 (2.55)
Liza saliens (3)
34.01 (7.7)
25.9 (21.7)
254.4 (251.5)
3.40 (1.28)
Liza ramada (3)
33.3 (5.2)
24.1 (11.1)
288.2(177.0)
3.78 (3.69)
Mugil cephalus (5)
45.1 (26.4)
16.3 (12.2)
261.5 (231.1)
11.91 (8.63)
Gobius niger (2)
41.5 (16.7)
12.3 (16.1)
20.0 (23.7)
1.17 (1.20)
Table 2. Mean values CJlglg fresh weight) of trace elements in pooled livers of several flSh species sampled in 1994 at Fogliano
lake
Species(n)
Hg
Cd
Ph
Se
Fe
Zn
en
Cr
Ni
Chelon labrosus (I)
0.08
0.09
1.10
0.92
176
46
175
0.43
1.54
Sparus aurata (1)
0.09
<0.01
<0.01
3.93
193
55
211
<0.01
1.82
Liza aurata (3)
0.14
0.20
0.85
9.40
456
54
511
1.82
9.89
Liza salisns (2)
0.10
0.16
0.69
1.53
413
74
479
2.32
6.45
Liza ramada (6)
0.12
0.14
< 0.Ql
7.48
568
59
639
1.51
6.92
Mugil cephalus (4)
0.13
0.21
0.70
6.09
605
112
656
0.16
2.81
Gobius niger (1)
0.19
0.34
1.30
7.46
67
45
82
3.45
1.55
S. Casini et al.
ramada, MugU cephalus. Gobius niger, and Solea
vulgaris were sampled in Fogliano lake. In July
1995 specimens of Liza au rata were sampled in
Fogliano and Caprolace lakes (midle of the lakes).
In June 1997 specimens of Liza aurata were sampled in two sites in Fogliano lake: A (by a sluice
that divides the lakes waters from a polluted
shipway, Rio Martino) and B (midle of the lake);
and one in Caprolace lake (midle of the lake, Bl).
All specimens were dissected immediately after
sacrifice the livers and brains were kept in liquid
nitrogen and muscle at -20°C until analysis.
After separation of the microsomal fraction,
the following MFO activities were evaluated:
ethoxyresorufin-o-deethylase (EROD) and
benzyloxyresorufin-o-deethylase (BROD) by the
method of Lubet et al. (1985); benzopyrenemono-oxygenase (BPMO) by the method of
Kurelec et al. (1977). Acetylcholinesterase activity was measured in brain homogenate by the
method of Ellman (1961).
Porphyrins (copro, uro and protoporphyrins) were measured in the liver by the method of
Grandchamp et al. (1980). Somatic Liver Index
[S.L.I. = (liver weighttbody weight) x 100] was
calculated for each specimen.
Qualitative and quantitative evaluation of the
levels of hexachlorobenzene, total DDTs and
total PCBs was performed in muscle by gas chromatography, using a Perkin-Elmer Autosystem
model equipped with Ni63 electron capture
detector and type SBP-5 (Supelco) bonded-phase
fused silica capillary columns.
Trace elements (Cd, Ph, Se, Zn, Cu, Cr, Ni»
were detected by plasma emission spectrometry
according to the method of Broekaert (1994),
mercury by flow injection mercury system by the
method of Stoeppler and Backhaus (1978).
Results
The results of biomarker analysis of the 1994
samples are shown in Table 1. The highest BPMO.
EROD and BROD activities were measured in the
three species of Liza and in MugU cephalus.
Gobius niger had the lowest EROD and BROD
activities. The lowest BPMO activity was measured in Solea vulgaris. AChE activity did not vary
substantially between the different species.
Trace metal concentrations found in liver are
shown in Table 2. Mercury concentrations were
less than 0.2 p.g/g fresh weight (f.w.) in all species. The highest concentrations were found in
Gobius niger (0.19 p.g/g f.w.). Cadmium concentrations were extremely low. Lead concentrations
Table 1. Biomarkers (mean values and standard deviations) in several fish species sampled in 1994 at Fogliano lake (min, minutes; prot, protein)
Spedes(n)
AChE activity
BPMO activity
EROD activity
BROD activity
(J1IDDlImin/g brain)
(A.UJmg protJmin)
(pmol/minlmg prot.)
(pmolJminJmg prot.)
Solea vulgaris (7)
38.65 (18.6)
2.1 (2.7)
72.8 (56.8)
2.32 (Ll8)
Liza aurata (4)
34.34 (5.1)
23.4 (16.7)
148.2 (234.9)
3.15 (2.55)
Liza saliens (3)
34.01 (7.7)
25.9 (21.7)
254.4 (251.5)
3.40 (1.28)
Liza ramada (3)
33.3 (5.2)
24.1 (11.1)
288.2(177.0)
3.78 (3.69)
Mugil cephalus (5)
45.1 (26.4)
16.3 (12.2)
261.5 (231.1)
11.91 (8.63)
Gobius niger (2)
41.5 (16.7)
12.3 (16.1)
20.0 (23.7)
1.17 (1.20)
Table 2. Mean values CJlglg fresh weight) of trace elements in pooled livers of several flSh species sampled in 1994 at Fogliano
lake
Species(n)
Hg
Cd
Ph
Se
Fe
Zn
en
Cr
Ni
Chelon labrosus (I)
0.08
0.09
1.10
0.92
176
46
175
0.43
1.54
Sparus aurata (1)
0.09
<0.01
<0.01
3.93
193
55
211
<0.01
1.82
Liza aurata (3)
0.14
0.20
0.85
9.40
456
54
511
1.82
9.89
Liza salisns (2)
0.10
0.16
0.69
1.53
413
74
479
2.32
6.45
Liza ramada (6)
0.12
0.14
< 0.Ql
7.48
568
59
639
1.51
6.92
Mugil cephalus (4)
0.13
0.21
0.70
6.09
605
112
656
0.16
2.81
Gobius niger (1)
0.19
0.34
1.30
7.46
67
45
82
3.45
1.55