

472
P. Vlaroli et al.
Thble 1. Ulva biomass (gDWm- 2 ), and total carbon (% DW),
total nitrogen (% DW) and atomic C:N ratios in macroalgal
thalli at station 17 in the Sacca di Goro in 1997. Mean values±standard deviation of three replicates are reported
Date
BioIDaIlll Carbon
Nitrogen
C:N
23 m January 74± 17 33.8±1.47 4.89±0.21 8.07±O.12
17"h April
219 ± 96 28.9 ± O.lS 3.34 ± 0.02 lO.09± 0.68
27"h May
878±302 30.1±0.59 2.14±0.47 16.91±3.S6
300
---0-- biomass - C
sulphides
200
100
--oxygen-surface
oxygen-bottom
o+---~--.-~~---.--~~~--~
o 30 60 90 120 150 180 210
Julian days
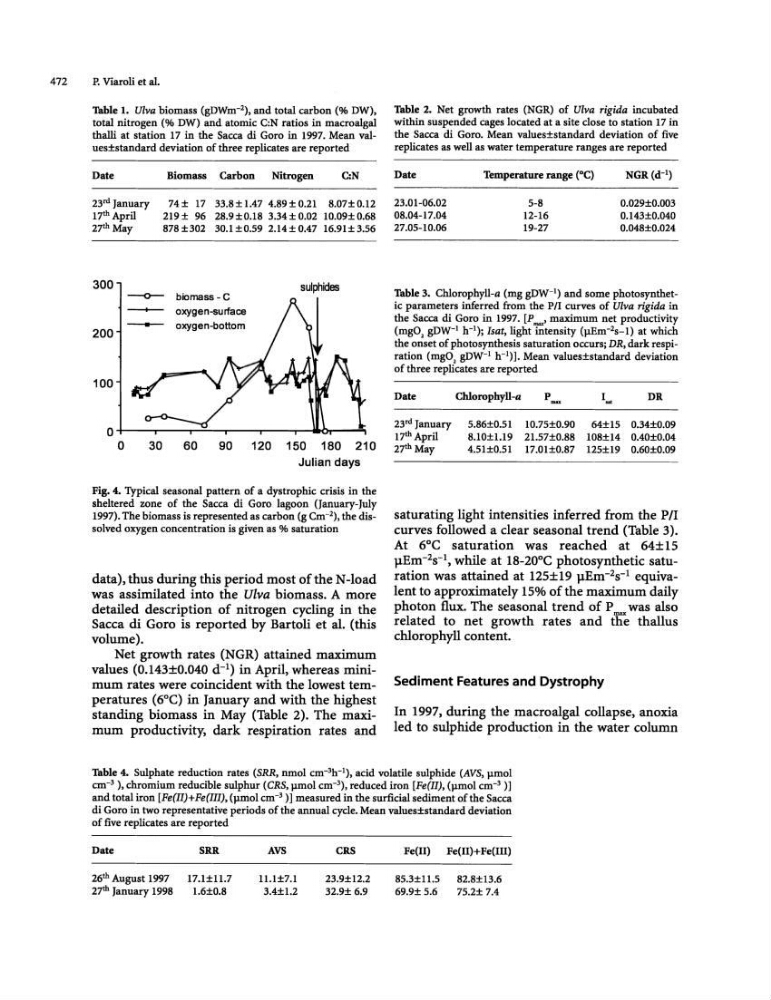
Fig. 4. '!ypical seasonal pattern of a dystrophic crisis in the
sheltered zone of the Sacca di Goro lagoon (January-July
1997). The biomass is represented as carbon (g Cm- 2 ), the dissolved oxygen concentration is given as % saturation
data), thus during this period most of the N-Ioad
was assimilated into the Ulva biomass. A more
detailed description of nitrogen cycling in the
Sacca di Goro is reported by Bartoli et al. (this
volume).
Net growth rates (NGR) attained maximum
values (O.143±O.040 d- 1 ) in April, whereas minimum rates were coincident with the lowest temperatures (6°C) in January and with the highest
standing biomass in May (Table 2). The maximum productivity. dark respiration rates and
Table 2. Net growth rates (NGR) of mva rigida incubated
within suspended cages located at a site close to station 17 in
the Sacca di Goro. Mean values±standard deviation of five
replicates as well as water temperature ranges are reported
Date
Temperature range ("C)
NGR (d- 1 )
23.01-06.02
5-8
0.029±o.o03
08.04-17.04
12-16
0.143±O.040
27.05-10.06
19-27
0.048±O.O24
Table 3. Chlorophyll-a (mg gDW-l) and some photosynthetic parameters inferred from the P/I curves of Ulva rigido. in
the Sacca di Goro in 1997. [P _, maximum net productivity
(mgO. gDW- 1 h- I ); Isat, light intensity (pEm- 2 s-1) at which
the onset of photosynthesis saturation occurs; DR, dark respiration (mgO. gDW- 1 h- I )]. Mean values±standard deviation
of three replicates are reported
Date
23 rd January
1]lh April
2]lhMay
Chlorophyll-a
DR
S.86±0.51 1O.75±O.90 64±lS O.34±O.09
S.10±1.l9 21.57±O.88 l08±14 O.40±O.04
4.S1±O.SI 17.01±0.87 125±19 O.60±0.09
saturating light intensities inferred from the PII
curves followed a clear seasonal trend (Table 3).
At 6°e saturation was reached at 64± 15
}lEm- 2 s-1, while at IS-20De photosynthetic saturation was attained at 125±19 p.Em- 2 s- 1 equivalent to approximately 15% of the maximum daily
photon flux. The seasonal trend of P was also
related to net growth rates and the thallus
chlorophyll content.
Sediment Features and Dystrophy
In 1997) during the macro algal collapse, anoxia
led to sulphide production in the water column
Table 4. Sulphate reduction rates (SRR, nmol cm- 3 h- 1 ). acid volatile sulphide (AVS, }lmol
cm- 3 ), chromium reducible sulphur (CRS, JlDlol cm- 3 ), reduced iron [Fe(l1), (JlDlol cm- 3 )]
and total iron [Fe(II)+Fe(III), (pmol cm- 3 )] measured in the surficial sediment of the Sacca
di Goro in two representative periods of the annual cycle. Mean values±standard deviation
of five replicates are reported
Date
SRR
2()fh August 1997
17.1±11.7
27 th January 1998
1.6±O.8
AVS
11.l±7.1
3.4±1.2
eRS
23.9±12.2
32.9± 6.9
Fe(lI)
Fe(II)+Fe(I1I)
85.3±1l.5
82.8±13.6
69.9± 5.6
7S.2± 7.4
P. Vlaroli et al.
Thble 1. Ulva biomass (gDWm- 2 ), and total carbon (% DW),
total nitrogen (% DW) and atomic C:N ratios in macroalgal
thalli at station 17 in the Sacca di Goro in 1997. Mean values±standard deviation of three replicates are reported
Date
BioIDaIlll Carbon
Nitrogen
C:N
23 m January 74± 17 33.8±1.47 4.89±0.21 8.07±O.12
17"h April
219 ± 96 28.9 ± O.lS 3.34 ± 0.02 lO.09± 0.68
27"h May
878±302 30.1±0.59 2.14±0.47 16.91±3.S6
300
---0-- biomass - C
sulphides
200
100
--oxygen-surface
oxygen-bottom
o+---~--.-~~---.--~~~--~
o 30 60 90 120 150 180 210
Julian days
Fig. 4. '!ypical seasonal pattern of a dystrophic crisis in the
sheltered zone of the Sacca di Goro lagoon (January-July
1997). The biomass is represented as carbon (g Cm- 2 ), the dissolved oxygen concentration is given as % saturation
data), thus during this period most of the N-Ioad
was assimilated into the Ulva biomass. A more
detailed description of nitrogen cycling in the
Sacca di Goro is reported by Bartoli et al. (this
volume).
Net growth rates (NGR) attained maximum
values (O.143±O.040 d- 1 ) in April, whereas minimum rates were coincident with the lowest temperatures (6°C) in January and with the highest
standing biomass in May (Table 2). The maximum productivity. dark respiration rates and
Table 2. Net growth rates (NGR) of mva rigida incubated
within suspended cages located at a site close to station 17 in
the Sacca di Goro. Mean values±standard deviation of five
replicates as well as water temperature ranges are reported
Date
Temperature range ("C)
NGR (d- 1 )
23.01-06.02
5-8
0.029±o.o03
08.04-17.04
12-16
0.143±O.040
27.05-10.06
19-27
0.048±O.O24
Table 3. Chlorophyll-a (mg gDW-l) and some photosynthetic parameters inferred from the P/I curves of Ulva rigido. in
the Sacca di Goro in 1997. [P _, maximum net productivity
(mgO. gDW- 1 h- I ); Isat, light intensity (pEm- 2 s-1) at which
the onset of photosynthesis saturation occurs; DR, dark respiration (mgO. gDW- 1 h- I )]. Mean values±standard deviation
of three replicates are reported
Date
23 rd January
1]lh April
2]lhMay
Chlorophyll-a
DR
S.86±0.51 1O.75±O.90 64±lS O.34±O.09
S.10±1.l9 21.57±O.88 l08±14 O.40±O.04
4.S1±O.SI 17.01±0.87 125±19 O.60±0.09
saturating light intensities inferred from the PII
curves followed a clear seasonal trend (Table 3).
At 6°e saturation was reached at 64± 15
}lEm- 2 s-1, while at IS-20De photosynthetic saturation was attained at 125±19 p.Em- 2 s- 1 equivalent to approximately 15% of the maximum daily
photon flux. The seasonal trend of P was also
related to net growth rates and the thallus
chlorophyll content.
Sediment Features and Dystrophy
In 1997) during the macro algal collapse, anoxia
led to sulphide production in the water column
Table 4. Sulphate reduction rates (SRR, nmol cm- 3 h- 1 ). acid volatile sulphide (AVS, }lmol
cm- 3 ), chromium reducible sulphur (CRS, JlDlol cm- 3 ), reduced iron [Fe(l1), (JlDlol cm- 3 )]
and total iron [Fe(II)+Fe(III), (pmol cm- 3 )] measured in the surficial sediment of the Sacca
di Goro in two representative periods of the annual cycle. Mean values±standard deviation
of five replicates are reported
Date
SRR
2()fh August 1997
17.1±11.7
27 th January 1998
1.6±O.8
AVS
11.l±7.1
3.4±1.2
eRS
23.9±12.2
32.9± 6.9
Fe(lI)
Fe(II)+Fe(I1I)
85.3±1l.5
82.8±13.6
69.9± 5.6
7S.2± 7.4