

scoc along a Shelf-slope Transect in the Western Gulf of lions
409
2°30'
3°00'
3°30'
4°00'
FRANCE
43°30'
rth
SPAIN
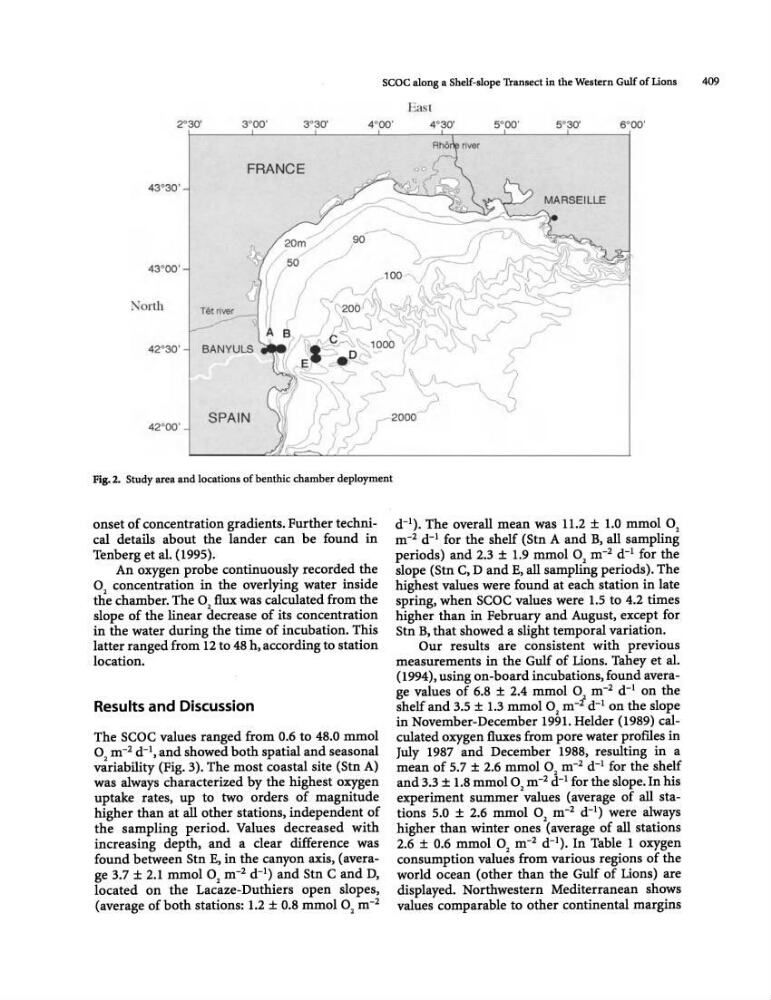
Fig. 2. Study area and locations of benthic chamber deployment
onset of concentration gradients. Further technical details about the lander can be found in
Tenberg et al. (1995).
An oxygen probe continuously recorded the
° 2 concentration in the overlying water inside
the chamber. The 02 flux was calculated from the
slope of the linear decrease of its concentration
in the water during the time of incubation. This
latter ranged from 12 to 48 h, according to station
location.
Results and Discussion
The SCOC values ranged from 0.6 to 48.0 mmol
02 m- 2 d- l , and showed both spatial and seasonal
variability (Fig. 3). The most coastal site (Stn A)
was always characterized by the highest oxygen
uptake rates, up to two orders of magnitude
higher than at all other stations, independent of
the sampling period. Values decreased with
increasing depth, and a clear difference was
found between Stn E, in the canyon axis, (average 3.7 ± 2.1 mmol 02 m- 2 d- l ) and Stn C and D,
located on the Lacaze-Duthiers open slopes,
(average of both stations: 1.2 ± 0.8 mmol 02 m- 2
5°30'
6°00'
d- l ). The overall mean was 11.2 ± 1.0 mmol 02
m- 2 d- l for the shelf (Stn A and B, all sampling
periods) and 2.3 ± 1.9 mmol 02 m- 2 d- l for the
slope (Stn C, D and E, all sampling periods). The
highest values were found at each station in late
spring, when SCOC values were 1.5 to 4.2 times
higher than in February and August, except for
Stn B, that showed a slight temporal variation.
Our results are consistent with previous
measurements in the Gulf of Lions. Tahey et al.
(1994), using on-board incubations, found average values of 6.8 ± 2.4 mmol ° m- 2 d- l on the
shelf and 3.5 ± 1.3 mmol 02 m-:t d- l on the slope
in November-December 1991. Helder (1989) calculated oxygen fluxes from pore water profiles in
July 1987 and December 1988, resulting in a
mean of 5.7 ± 2.6 mmol 02 m- 2 d- l for the shelf
and 3.3 ± 1.8 mmol 02 m- 2 d- l for the slope. In his
experiment summer values (average of all stations 5.0 ± 2.6 mmol 02 m- 2 d- l ) were always
higher than winter ones (average of all stations
2.6 ± 0.6 mmol 02 m- 2 d- 1 ). In Table 1 oxygen
consumption values from various regions of the
world ocean (other than the Gulf of Lions) are
displayed. Northwestern Mediterranean shows
values comparable to other continental margins
409
2°30'
3°00'
3°30'
4°00'
FRANCE
43°30'
rth
SPAIN
Fig. 2. Study area and locations of benthic chamber deployment
onset of concentration gradients. Further technical details about the lander can be found in
Tenberg et al. (1995).
An oxygen probe continuously recorded the
° 2 concentration in the overlying water inside
the chamber. The 02 flux was calculated from the
slope of the linear decrease of its concentration
in the water during the time of incubation. This
latter ranged from 12 to 48 h, according to station
location.
Results and Discussion
The SCOC values ranged from 0.6 to 48.0 mmol
02 m- 2 d- l , and showed both spatial and seasonal
variability (Fig. 3). The most coastal site (Stn A)
was always characterized by the highest oxygen
uptake rates, up to two orders of magnitude
higher than at all other stations, independent of
the sampling period. Values decreased with
increasing depth, and a clear difference was
found between Stn E, in the canyon axis, (average 3.7 ± 2.1 mmol 02 m- 2 d- l ) and Stn C and D,
located on the Lacaze-Duthiers open slopes,
(average of both stations: 1.2 ± 0.8 mmol 02 m- 2
5°30'
6°00'
d- l ). The overall mean was 11.2 ± 1.0 mmol 02
m- 2 d- l for the shelf (Stn A and B, all sampling
periods) and 2.3 ± 1.9 mmol 02 m- 2 d- l for the
slope (Stn C, D and E, all sampling periods). The
highest values were found at each station in late
spring, when SCOC values were 1.5 to 4.2 times
higher than in February and August, except for
Stn B, that showed a slight temporal variation.
Our results are consistent with previous
measurements in the Gulf of Lions. Tahey et al.
(1994), using on-board incubations, found average values of 6.8 ± 2.4 mmol ° m- 2 d- l on the
shelf and 3.5 ± 1.3 mmol 02 m-:t d- l on the slope
in November-December 1991. Helder (1989) calculated oxygen fluxes from pore water profiles in
July 1987 and December 1988, resulting in a
mean of 5.7 ± 2.6 mmol 02 m- 2 d- l for the shelf
and 3.3 ± 1.8 mmol 02 m- 2 d- l for the slope. In his
experiment summer values (average of all stations 5.0 ± 2.6 mmol 02 m- 2 d- l ) were always
higher than winter ones (average of all stations
2.6 ± 0.6 mmol 02 m- 2 d- 1 ). In Table 1 oxygen
consumption values from various regions of the
world ocean (other than the Gulf of Lions) are
displayed. Northwestern Mediterranean shows
values comparable to other continental margins