

(1958, 1961) used descriptions and samples
taken by Duilio Marcante and the divers of the
"Centro Subacqueo" of Genoa: the lack of precise, quantitative data prevents any conclusions.
A few years after Tortonese, in 1959 and 1962,
Rossi (1965) worked at Punta Mesco (Fig. 1) with
the help of the underwater photographer Gianni
Roghi. Thanks to photography, she was able to
provide (semi-) quantitative data of the sessile
biota living on rocks 17 to 44 m deep. In 19901991, Peirano and Sassarini (1992) took photos
in different stations of the same site, whereas in
1996 Peirano et al. (2000) were able to relocate
both the 1959/1962 and 1990-1991 stations, taking new photographs of the epibenthic communities. Change was measured using the dissimilarity index I-Sk, where Sk is the Kulczynski's
similarity coefficient (Boudouresque 1971).
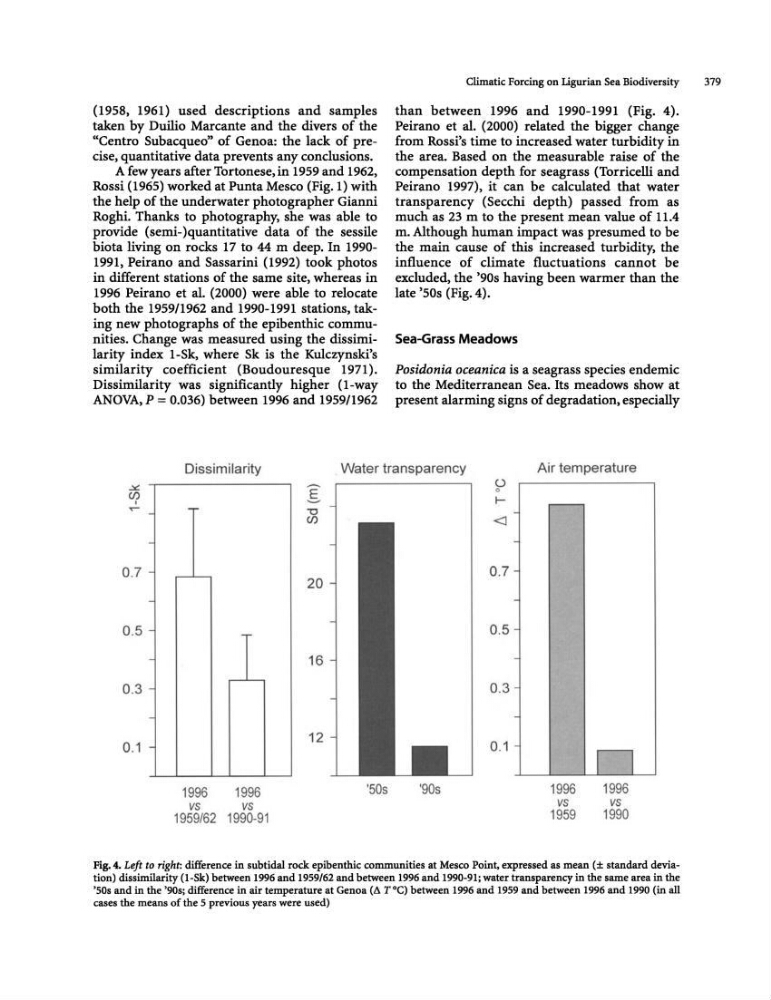
Dissimilarity was significantly higher (1 -way
ANOVA,P = 0.036) between 1996 and 1959/1962
Climatic Forcing on Ligurian Sea Biodiversity
379
than between 1996 and 1990-1991 (Fig. 4).
Peirano et al. (2000) related the bigger change
from Rossi's time to increased water turbidity in
the area. Based on the measurable raise of the
compensation depth for seagrass (Torricelli and
Peirano 1997), it can be calculated that water
transparency (Secchi depth) passed from as
much as 23 m to the present mean value of 11.4
m. Although human impact was presumed to be
the main cause of this increased turbidity, the
influence of climate fluctuations cannot be
excluded, the '90s having been warmer than the
late '50s (Fig. 4).
Sea-Grass Meadows
Posidonia oceanica is a seagrass species endemic
to the Mediterranean Sea. Its meadows show at
present alarming signs of degradation, especially
Dissimilarity
Water transparency
Air temperature
0.7
-20
0.5 -
-
16
- ' - -
0.3 -
-
-
0.1
12
1996
1996
vs
vs
1959/62 1990-91
o o
I
0.5
0.3
0 .1
'50s
'90s
-
1996
vs
1959
n
1996
vs
1990
Fig. 4. Left to right: difference in subtidal rock epibenthic communities at Mesco Point, expressed as mean (± standard deviation) dissimilarity (l-Sk) between 1996 and 1959/62 and between 1996 and 1990-91; water transparency in the same area in the
'50s and in the '90s; difference in air temperature at Genoa (~ T°C) between 1996 and 1959 and between 1996 and 1990 (in all
cases the means of the 5 previous years were used)
taken by Duilio Marcante and the divers of the
"Centro Subacqueo" of Genoa: the lack of precise, quantitative data prevents any conclusions.
A few years after Tortonese, in 1959 and 1962,
Rossi (1965) worked at Punta Mesco (Fig. 1) with
the help of the underwater photographer Gianni
Roghi. Thanks to photography, she was able to
provide (semi-) quantitative data of the sessile
biota living on rocks 17 to 44 m deep. In 19901991, Peirano and Sassarini (1992) took photos
in different stations of the same site, whereas in
1996 Peirano et al. (2000) were able to relocate
both the 1959/1962 and 1990-1991 stations, taking new photographs of the epibenthic communities. Change was measured using the dissimilarity index I-Sk, where Sk is the Kulczynski's
similarity coefficient (Boudouresque 1971).
Dissimilarity was significantly higher (1 -way
ANOVA,P = 0.036) between 1996 and 1959/1962
Climatic Forcing on Ligurian Sea Biodiversity
379
than between 1996 and 1990-1991 (Fig. 4).
Peirano et al. (2000) related the bigger change
from Rossi's time to increased water turbidity in
the area. Based on the measurable raise of the
compensation depth for seagrass (Torricelli and
Peirano 1997), it can be calculated that water
transparency (Secchi depth) passed from as
much as 23 m to the present mean value of 11.4
m. Although human impact was presumed to be
the main cause of this increased turbidity, the
influence of climate fluctuations cannot be
excluded, the '90s having been warmer than the
late '50s (Fig. 4).
Sea-Grass Meadows
Posidonia oceanica is a seagrass species endemic
to the Mediterranean Sea. Its meadows show at
present alarming signs of degradation, especially
Dissimilarity
Water transparency
Air temperature
0.7
-20
0.5 -
-
16
- ' - -
0.3 -
-
-
0.1
12
1996
1996
vs
vs
1959/62 1990-91
o o
I
0.5
0.3
0 .1
'50s
'90s
-
1996
vs
1959
n
1996
vs
1990
Fig. 4. Left to right: difference in subtidal rock epibenthic communities at Mesco Point, expressed as mean (± standard deviation) dissimilarity (l-Sk) between 1996 and 1959/62 and between 1996 and 1990-91; water transparency in the same area in the
'50s and in the '90s; difference in air temperature at Genoa (~ T°C) between 1996 and 1959 and between 1996 and 1990 (in all
cases the means of the 5 previous years were used)