

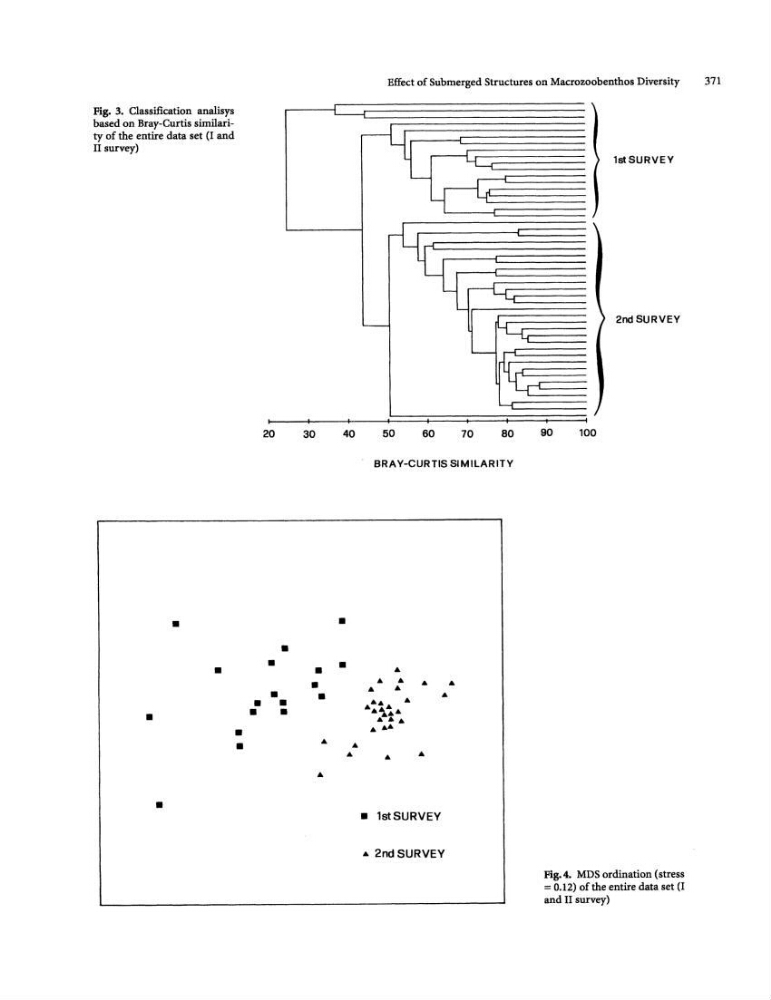
Fig. 3. Classification analisys
based on Bray-Curtis similarity of the entire data set (I and
II survey)
•
•
•
•
•
•
I
20
•
•
•
•
I
I
30
40
•
• • •
•
• •
• . . . .
•
...
Effect of Submerged Structures on Macro7.oobenthos Diversity
371
--L[
~-r--t
0{
tLcr
' - -
iL-Lr
' - - - ~
-I
I
I
I
50
60
70
80
BRAY-CURTIS SIMILARITY
. .
. . . . .. ...
... •
..
... . ...
.. ~~ .
... ..
.....
• . .
• 1stSURVEV
... 2ndSURVEV
1st SURVEY
2nd SURVEY
I
I
90
100
Fig.4. MDS ordination (stress
= 0.12) of the entire data set (I
and II survey)
based on Bray-Curtis similarity of the entire data set (I and
II survey)
•
•
•
•
•
•
I
20
•
•
•
•
I
I
30
40
•
• • •
•
• •
• . . . .
•
...
Effect of Submerged Structures on Macro7.oobenthos Diversity
371
--L[
~-r--t
0{
tLcr
' - -
iL-Lr
' - - - ~
-I
I
I
I
50
60
70
80
BRAY-CURTIS SIMILARITY
. .
. . . . .. ...
... •
..
... . ...
.. ~~ .
... ..
.....
• . .
• 1stSURVEV
... 2ndSURVEV
1st SURVEY
2nd SURVEY
I
I
90
100
Fig.4. MDS ordination (stress
= 0.12) of the entire data set (I
and II survey)