

372
R. Crema et at.
Table 3. Means and Student's t statistics of Shannon diversity and Bray-Curtis similarity in
the two investigated periods
Mean
lstsurvey
2nd survey
Shannon diversity
3.37 ± 0.68
3.29 ± 0.44
Bray-Curtis similarity
52.47 ± lO.82 66.51 ±15.16
The ordination model, performed by MDS
from the same similarity matrix (Fig. 4), gives
similar results, generating two separate samplepoint groups of which those pertaining to the
second period are much closer than those of the
first period.
Results of an independent t-test for the differences between means of Shannon diversity of
the single samples and of Bray-Curtis similarity
between samples are given in Table 3. They point
out that, whereas the diversity of the single samples is the same in the two periods, the level of
similarity between samples is significantly
greater in the second period.
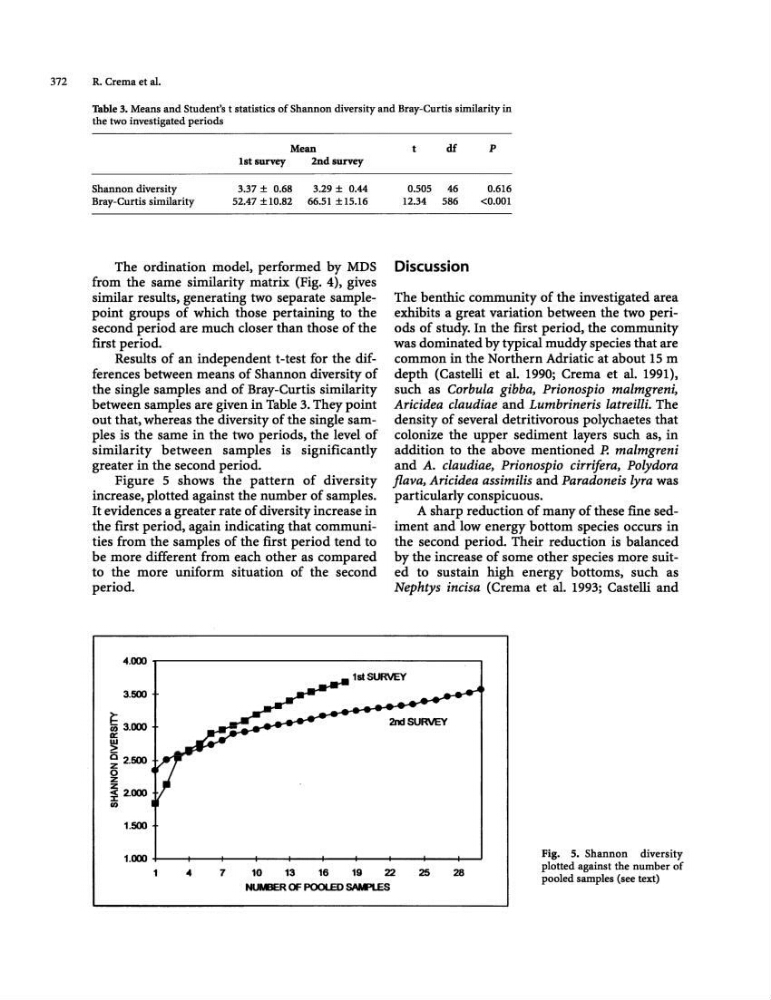
Figure 5 shows the pattern of diversity
increase, plotted against the number of samples.
It evidences a greater rate of diversity increase in
the first period, again indicating that communities from the samples of the first period tend to
be more different from each other as compared
to the more uniform situation of the second
period.
4.000
t
df
P
0.505 46
0.616
12.34 586
<0.001
Discussion
The benthic community of the investigated area
exhibits a great variation between the two periods of study. In the first period, the community
was dominated by typical muddy species that are
common in the Northern Adriatic at about 15 m
depth (Castelli et al. 1990; Crema et al. 1991),
such as Corbula gibba. Prionospio malmgreni,
Aricidea claudiae and Lumbrineris latreilli. The
density of several detritivorous polychaetes that
colonize the upper sediment layers such as, in
addition to the above mentioned P. malmgreni
and A. claudiae, Prionospio cirrifera. Polydora
jlava, Aricidea assimilis and Paradoneis lyra was
particularly conspicuous.
A sharp reduction of many of these fine sediment and low energy bottom species occurs in
the second period. Their reduction is balanced
by the increase of some other species more suited to sustain high energy bottoms, such as
Nephtys incisa (Crema et al. 1993; Castelli and
1st SURVEY
3.500
f;:
II) 3.000
«
~
~ 2.500
0
z
~ 2.000
II)
1.500
1.000
1
2nd SURVEY
1
10
13
16
19
22
25
NUMBER OF POOlED SAMPl.ES
28
Fig. 5. Shannon diversity
plotted against the number of
pooled samples (see text)
R. Crema et at.
Table 3. Means and Student's t statistics of Shannon diversity and Bray-Curtis similarity in
the two investigated periods
Mean
lstsurvey
2nd survey
Shannon diversity
3.37 ± 0.68
3.29 ± 0.44
Bray-Curtis similarity
52.47 ± lO.82 66.51 ±15.16
The ordination model, performed by MDS
from the same similarity matrix (Fig. 4), gives
similar results, generating two separate samplepoint groups of which those pertaining to the
second period are much closer than those of the
first period.
Results of an independent t-test for the differences between means of Shannon diversity of
the single samples and of Bray-Curtis similarity
between samples are given in Table 3. They point
out that, whereas the diversity of the single samples is the same in the two periods, the level of
similarity between samples is significantly
greater in the second period.
Figure 5 shows the pattern of diversity
increase, plotted against the number of samples.
It evidences a greater rate of diversity increase in
the first period, again indicating that communities from the samples of the first period tend to
be more different from each other as compared
to the more uniform situation of the second
period.
4.000
t
df
P
0.505 46
0.616
12.34 586
<0.001
Discussion
The benthic community of the investigated area
exhibits a great variation between the two periods of study. In the first period, the community
was dominated by typical muddy species that are
common in the Northern Adriatic at about 15 m
depth (Castelli et al. 1990; Crema et al. 1991),
such as Corbula gibba. Prionospio malmgreni,
Aricidea claudiae and Lumbrineris latreilli. The
density of several detritivorous polychaetes that
colonize the upper sediment layers such as, in
addition to the above mentioned P. malmgreni
and A. claudiae, Prionospio cirrifera. Polydora
jlava, Aricidea assimilis and Paradoneis lyra was
particularly conspicuous.
A sharp reduction of many of these fine sediment and low energy bottom species occurs in
the second period. Their reduction is balanced
by the increase of some other species more suited to sustain high energy bottoms, such as
Nephtys incisa (Crema et al. 1993; Castelli and
1st SURVEY
3.500
f;:
II) 3.000
«
~
~ 2.500
0
z
~ 2.000
II)
1.500
1.000
1
2nd SURVEY
1
10
13
16
19
22
25
NUMBER OF POOlED SAMPl.ES
28
Fig. 5. Shannon diversity
plotted against the number of
pooled samples (see text)