

Physical and Geochemical Transports Along the Ancona Coastal Area
15
characterized by some inversions in direction
(Fig. 4). More detail about the current measurements and variability in this period can be found
in Budillon et al. (2000a, b).
Fresh Water Transport
The fresh water transport calculated through all
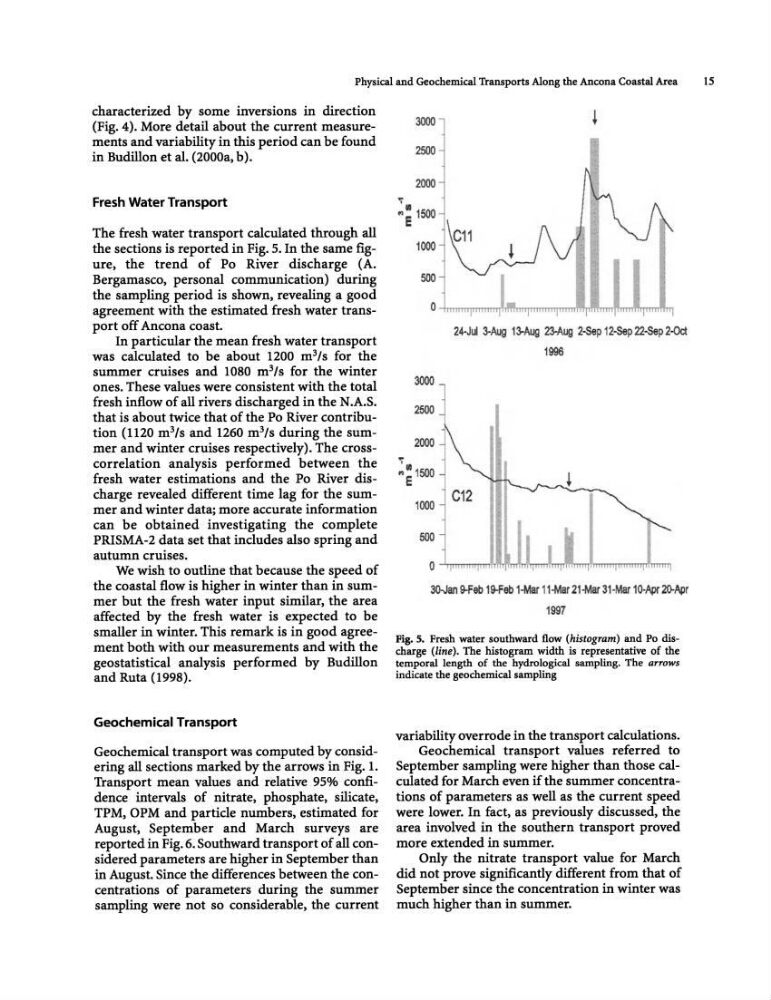
the sections is reported in Fig. 5. In the same figure, the trend of Po River discharge (A.
Bergamasco, personal communication) during
the sampling period is shown, revealing a good
agreement with the estimated fresh water transport off Ancona coast.
In particular the mean fresh water transport
was calculated to be about 1200 m 3 /s for the
summer cruises and 1080 m 3 /s for the winter
ones. These values were consistent with the total
fresh inflow of all rivers discharged in the N .A.S.
that is about twice that of the Po River contribution (1120 m 3 /s and 1260 m 3 /s during the summer and winter cruises respectively). The crosscorrelation analysis performed between the
fresh water estimations and the Po River discharge revealed different time lag for the summer and winter data; more accurate information
can be obtained investigating the complete
PRISMA-2 data set that includes also spring and
autumn cruises.
We wish to outline that because the speed of
the coastal flow is higher in winter than in summer but the fresh water input similar, the area
affected by the fresh water is expected to be
smaller in winter. This remark is in good agreement both with our measurements and with the
geostatistical analysis performed by Budillon
and Ruta (1998).
Geochemical Transport
Geochemical transport was computed by considering all sections marked by the arrows in Fig. 1.
Transport mean values and relative 95% confidence intervals of nitrate, phosphate, silicate,
TPM, OPM and particle numbers, estimated for
August, September and March surveys are
reported in Fig. 6. Southward transport of all considered parameters are higher in September than
in August. Since the differences between the concentrations of parameters during the summer
sampling were not so considerable, the current
3000
2500
2000
..
.,111 1500
E
1000
500
0
3000
2500
2000
~ 111 1500
E
1000
500
+
24-Jul 3-Aug 13-Aug 23-Aug 2-Sep 12-Sep 22-Sep 2-Oct
1996
O ~~m=~~~mm~~~mm~m=~rrm
3O-Jan 9-Feb 19-Feb 1-Mar 11-Mar 21-Mar 31-Mar la-Apr 2O-Apr
1997
Fig. 5. Fresh water southward flow (histogram) and Po discharge (line). The histogram width is representative of the
temporal length of the hydrological sampling. The arrows
indicate the geochemical sampling
variability overrode in the transport calculations.
Geochemical transport values referred to
September sampling were higher than those calculated for March even if the summer concentrations of parameters as well as the current speed
were lower. In fact, as previously discussed, the
area involved in the southern transport proved
more extended in summer.
Only the nitrate transport value for March
did not prove significantly different from that of
September since the concentration in winter was
much higher than in summer.
15
characterized by some inversions in direction
(Fig. 4). More detail about the current measurements and variability in this period can be found
in Budillon et al. (2000a, b).
Fresh Water Transport
The fresh water transport calculated through all
the sections is reported in Fig. 5. In the same figure, the trend of Po River discharge (A.
Bergamasco, personal communication) during
the sampling period is shown, revealing a good
agreement with the estimated fresh water transport off Ancona coast.
In particular the mean fresh water transport
was calculated to be about 1200 m 3 /s for the
summer cruises and 1080 m 3 /s for the winter
ones. These values were consistent with the total
fresh inflow of all rivers discharged in the N .A.S.
that is about twice that of the Po River contribution (1120 m 3 /s and 1260 m 3 /s during the summer and winter cruises respectively). The crosscorrelation analysis performed between the
fresh water estimations and the Po River discharge revealed different time lag for the summer and winter data; more accurate information
can be obtained investigating the complete
PRISMA-2 data set that includes also spring and
autumn cruises.
We wish to outline that because the speed of
the coastal flow is higher in winter than in summer but the fresh water input similar, the area
affected by the fresh water is expected to be
smaller in winter. This remark is in good agreement both with our measurements and with the
geostatistical analysis performed by Budillon
and Ruta (1998).
Geochemical Transport
Geochemical transport was computed by considering all sections marked by the arrows in Fig. 1.
Transport mean values and relative 95% confidence intervals of nitrate, phosphate, silicate,
TPM, OPM and particle numbers, estimated for
August, September and March surveys are
reported in Fig. 6. Southward transport of all considered parameters are higher in September than
in August. Since the differences between the concentrations of parameters during the summer
sampling were not so considerable, the current
3000
2500
2000
..
.,111 1500
E
1000
500
0
3000
2500
2000
~ 111 1500
E
1000
500
+
24-Jul 3-Aug 13-Aug 23-Aug 2-Sep 12-Sep 22-Sep 2-Oct
1996
O ~~m=~~~mm~~~mm~m=~rrm
3O-Jan 9-Feb 19-Feb 1-Mar 11-Mar 21-Mar 31-Mar la-Apr 2O-Apr
1997
Fig. 5. Fresh water southward flow (histogram) and Po discharge (line). The histogram width is representative of the
temporal length of the hydrological sampling. The arrows
indicate the geochemical sampling
variability overrode in the transport calculations.
Geochemical transport values referred to
September sampling were higher than those calculated for March even if the summer concentrations of parameters as well as the current speed
were lower. In fact, as previously discussed, the
area involved in the southern transport proved
more extended in summer.
Only the nitrate transport value for March
did not prove significantly different from that of
September since the concentration in winter was
much higher than in summer.