

260
A. Covazzi Harriague et al.
front of Savona are showed in Table 3b.
Meiofaunal abundance shows in Savona a clear
decreasing pattern with depth and from east to
west, average values ranging from 2040.4
indllOcm 2 (10 m) to 6S2.2 ind/l0cm 2 (SOm) and
between 2281.4 ind/l0cm 2 (transect SI) and
737.5 ind/l0m2 (transect S3).
Number of taxa is quite constant with depth.
ranging in average from 10 (20 m) to 12 (10 m).
Along the transects the top value is found at
transect 52 (on average 13) and the lowest at
transect S3 (10).
Similar to Genova nematodes constitute the
most represented taxon at all depths followed by
copepods. Nematode abundance percentage of
total meiofaunal community ranges on average
from 56.1% (20 m) to 71% (50 m). while copepods display the maximum percentage at 20 m
(on average 33.1%) and the minimum at 10 m
(17.6%). Nematodes dominate also along the
transects, the maximum percentage value is
observed at transect Sl (on average 82%), while
copepods reach their highest percentage at transect 82 {36.5%}.
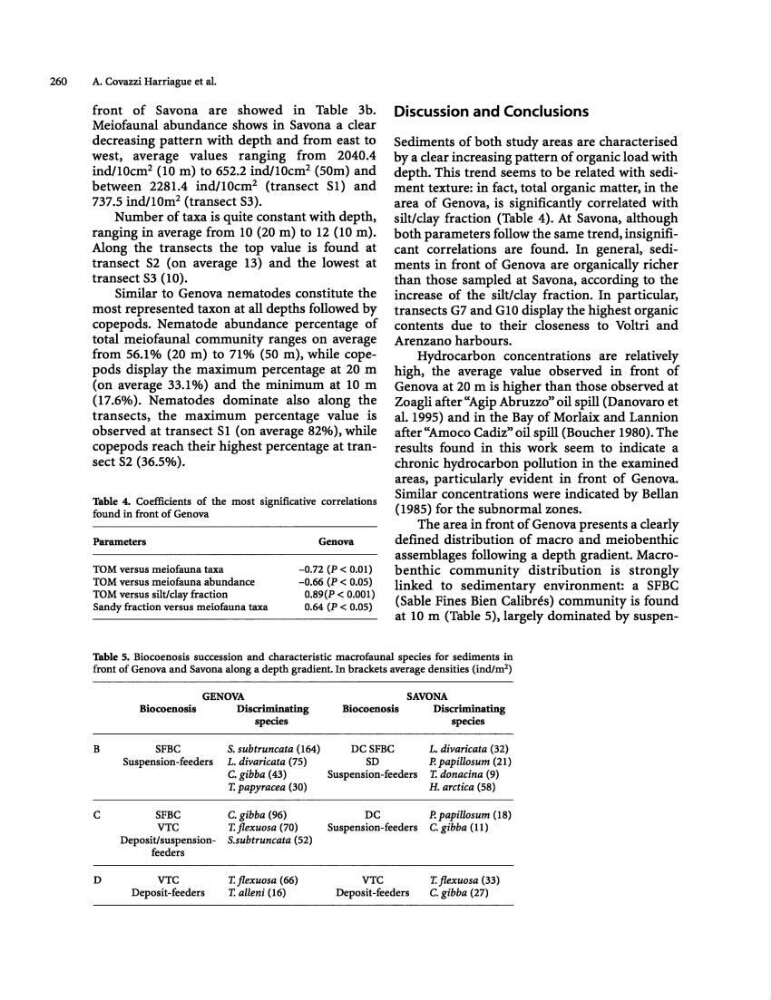
Thble 4. Coefficients of the most significative correlations
found in front of Genova
Parameters
TOM versus meiofauna taxa
TOM versus meiofauna abundance
TOM versus silt/clay fraction
Sandy fraction versus meiofauna taxa
Genova
-0.72 (P < 0.01)
-0.66 (P < 0.05)
0.89(P < 0.001)
0.64 (P < 0.05)
Discussion and Conclusions
Sediments of both study areas are characterised
by a clear increasing pattern of organic load with
depth. This trend seems to be related with sediment texture: in fact, total organic matter, in the
area of Genova, is significantly correlated with
silt/clay fraction (Table 4). At Savona, although
both parameters follow the same trend. insignificant correlations are found. In general, sediments in front of Genova are organically richer
than those sampled at Savona. according to the
increase of the silt! clay fraction. In particular,
transects G7 and GI0 display the highest organic
contents due to their closeness to Voltri and
Arenzano harbours.
Hydrocarbon concentrations are relatively
high, the average value observed in front of
Genova at 20 m is higher than those observed at
Zoagli after "Agip Abruzzo" oil spill (Danovaro et
al. 1995) and in the Bay of Morlaix and Lannion
after "Amoco Cadiz" oil spill (Boucher 1980). The
results found in this work seem to indicate a
chronic hydrocarbon pollution in the examined
areas, particularly evident in front of Genova.
Similar concentrations were indicated by Bellan
(1985) for the subnormal zones.
The area in front of Genova presents a clearly
defined distribution of macro and meiobenthic
assemblages following a depth gradient. Macrobenthic community distribution is strongly
linked to sedimentary environment: a SFBC
(Sable Fines Bien Calibres) community is found
at 10 m (Table 5), largely dominated by suspenThble 5. Biocoenosis succession and characteristic macrofaunal species for sediments in
front of Genova and Savona along a depth gradient. In brackets average densities (ind/ml)
GENOVA
SAVONA
Biocoenosis
Discriminating
Biocoenosis
Discriminating
species
species
B
SFBC
S. subtruncata (164)
DCSFBC
L. divaricata (32)
Suspension-feeders L. divaricata (75)
SD
P.papillosum (21)
C. gibba (43)
Suspension-feeders T. donacina (9)
T. papyracea (30)
H. arctica (58)
C
SFBC
C. gibba (96)
DC
P. papillosum (18)
VTC
T.jlexuosa (70)
Suspension-feeders C. gibba (11)
Deposit/suspension- S.subtruncata (52)
feeders
D
VTC
T.jlexuosa (66)
VTC
T.jlexuDsa (33)
Deposit-feeders
T. alieni (16)
Deposit-feeders
C. gibba (27)
A. Covazzi Harriague et al.
front of Savona are showed in Table 3b.
Meiofaunal abundance shows in Savona a clear
decreasing pattern with depth and from east to
west, average values ranging from 2040.4
indllOcm 2 (10 m) to 6S2.2 ind/l0cm 2 (SOm) and
between 2281.4 ind/l0cm 2 (transect SI) and
737.5 ind/l0m2 (transect S3).
Number of taxa is quite constant with depth.
ranging in average from 10 (20 m) to 12 (10 m).
Along the transects the top value is found at
transect 52 (on average 13) and the lowest at
transect S3 (10).
Similar to Genova nematodes constitute the
most represented taxon at all depths followed by
copepods. Nematode abundance percentage of
total meiofaunal community ranges on average
from 56.1% (20 m) to 71% (50 m). while copepods display the maximum percentage at 20 m
(on average 33.1%) and the minimum at 10 m
(17.6%). Nematodes dominate also along the
transects, the maximum percentage value is
observed at transect Sl (on average 82%), while
copepods reach their highest percentage at transect 82 {36.5%}.
Thble 4. Coefficients of the most significative correlations
found in front of Genova
Parameters
TOM versus meiofauna taxa
TOM versus meiofauna abundance
TOM versus silt/clay fraction
Sandy fraction versus meiofauna taxa
Genova
-0.72 (P < 0.01)
-0.66 (P < 0.05)
0.89(P < 0.001)
0.64 (P < 0.05)
Discussion and Conclusions
Sediments of both study areas are characterised
by a clear increasing pattern of organic load with
depth. This trend seems to be related with sediment texture: in fact, total organic matter, in the
area of Genova, is significantly correlated with
silt/clay fraction (Table 4). At Savona, although
both parameters follow the same trend. insignificant correlations are found. In general, sediments in front of Genova are organically richer
than those sampled at Savona. according to the
increase of the silt! clay fraction. In particular,
transects G7 and GI0 display the highest organic
contents due to their closeness to Voltri and
Arenzano harbours.
Hydrocarbon concentrations are relatively
high, the average value observed in front of
Genova at 20 m is higher than those observed at
Zoagli after "Agip Abruzzo" oil spill (Danovaro et
al. 1995) and in the Bay of Morlaix and Lannion
after "Amoco Cadiz" oil spill (Boucher 1980). The
results found in this work seem to indicate a
chronic hydrocarbon pollution in the examined
areas, particularly evident in front of Genova.
Similar concentrations were indicated by Bellan
(1985) for the subnormal zones.
The area in front of Genova presents a clearly
defined distribution of macro and meiobenthic
assemblages following a depth gradient. Macrobenthic community distribution is strongly
linked to sedimentary environment: a SFBC
(Sable Fines Bien Calibres) community is found
at 10 m (Table 5), largely dominated by suspenThble 5. Biocoenosis succession and characteristic macrofaunal species for sediments in
front of Genova and Savona along a depth gradient. In brackets average densities (ind/ml)
GENOVA
SAVONA
Biocoenosis
Discriminating
Biocoenosis
Discriminating
species
species
B
SFBC
S. subtruncata (164)
DCSFBC
L. divaricata (32)
Suspension-feeders L. divaricata (75)
SD
P.papillosum (21)
C. gibba (43)
Suspension-feeders T. donacina (9)
T. papyracea (30)
H. arctica (58)
C
SFBC
C. gibba (96)
DC
P. papillosum (18)
VTC
T.jlexuosa (70)
Suspension-feeders C. gibba (11)
Deposit/suspension- S.subtruncata (52)
feeders
D
VTC
T.jlexuosa (66)
VTC
T.jlexuDsa (33)
Deposit-feeders
T. alieni (16)
Deposit-feeders
C. gibba (27)