

Macro- and Meiobenthic Distribution in Anthropogenica1ly Impacted Sediment
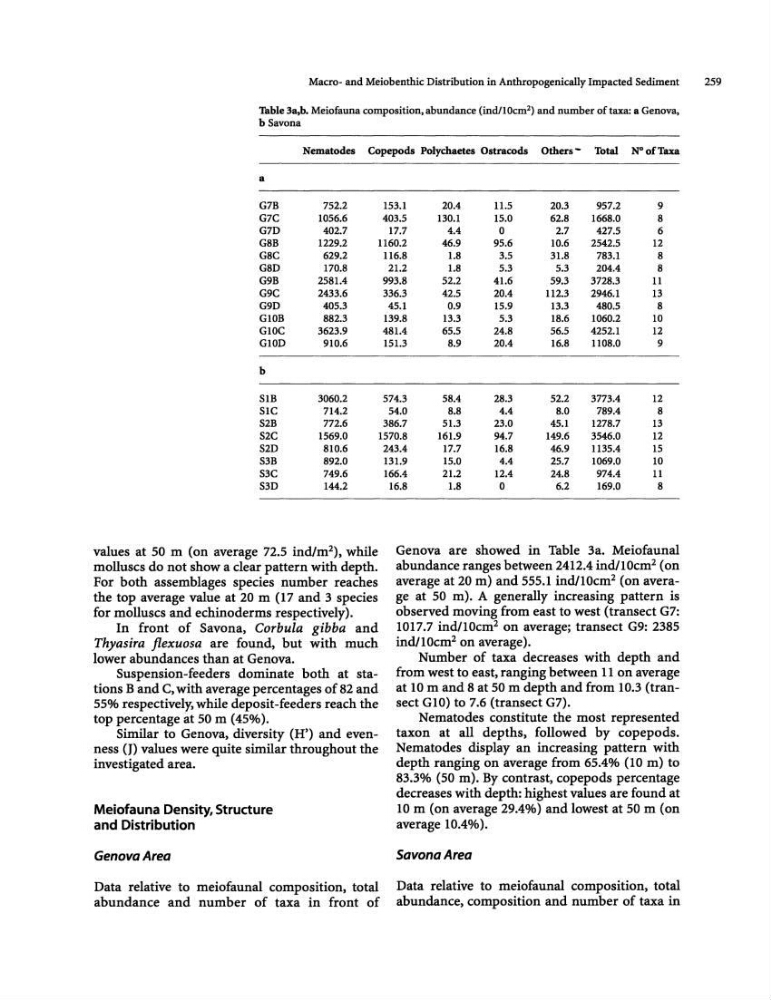
Table 3a,b. Meiofauna composition, abundance (ind/1 Ocm l ) and number of taxa: a Genova,
bSavona
Nematodes Copepods Polychaetes Ostracods Others- Total N"ofTaxa
a
G7B
752.2
153.1
20.4
11.5
20.3
957.2
9
G7C
1056.6
403.5
130.1
15.0
62.S
1668.0
8
G7D
402.7
17.7
4.4
0
2.7
427.5
6
GSB
1229.2
1160.2
46.9
95.6
10.6
2542.5
12
G8C
629.2
116.8
1.8
3.5
31.8
783.1
8
G8D
170.8
21.2
1.8
5.3
5.3
204.4
8
G9B
2581.4
993.8
52.2
41.6
59.3
3728.3
11
G9C
2433.6
336.3
42.5
20.4
112.3
2946.1
13
G9D
405.3
45.1
0.9
15.9
13.3
4S0.5
8
GlOB
882.3
139.8
13.3
5.3
18.6
1060.2
10
GIOC
3623.9
481.4
65.5
24.8
56.5
4252.1
12
G10D
910.6
151.3
8.9
2004
16.8
1108.0
9
b
SIB
3060.2
574.3
58.4
28.3
52.2
3773.4
12
SlC
714.2
54.0
8.8
4.4
11.0
789.4
8
S2B
772.6
386.7
51.3
23.0
45.1
1278.7
13
S2C
1569.0
1570.8
161.9
94.7
149.6
3546.0
12
S2D
81D.6
S3B
892.0
S3C
749.6
S3D
144.2
values at 50 m (on average 72.5 indlm 2 ), while
molluscs do not show a clear pattern with depth.
For both assemblages species number reaches
the top average value at 20 m (17 and 3 species
for molluscs and echinoderms respectively).
In front of Savona, Corbula gibba and
Thyasira Jlexuosa are found, but with much
lower abundances than at Genova.
Suspension-feeders dominate both at stations Band C, with average percentages of 82 and
55% respectively, while deposit-feeders reach the
top percentage at 50 m (45%).
Similar to Genova, diversity (H') and evenness 0) values were quite similar throughout the
investigated area.
Meiofauna Density, Structure
and Distribution
Genova Area
Data relative to meiofaunal composition, total
abundance and number of taxa in front of
243.4
17.7
16.8
46.9
1135.4
15
131.9
15.0
4.4
25.7
1069.0
10
166.4
21.2
12.4
24.8
974.4
11
16.8
1.8
0
6.2
169.0
8
Genova are showed in Table 3a. Meiofaunal
abundance ranges between 2412.4 indll0cm 2 (on
average at 20 m) and 555.1 indl1Ocm 2 (on average at 50 m). A generally increasing pattern is
observed moving from east to west (transect G7:
1017.7 indl1Ocm 2 on average; transect G9: 2385
indll0cm 2 on average).
Number of taxa decreases with depth and
from west to east, ranging between lIon average
at 10 m and 8 at 50 m depth and from 10.3 (transect GI0) to 7.6 (transect G7).
Nematodes constitute the most represented
taxon at all depths, followed by copepods.
Nematodes display an increasing pattern with
depth ranging on average from 65.4% (10 m) to
83.3% (SO m). By contrast, copepods percentage
decreases with depth: highest values are found at
10 m (on average 29.4%) and lowest at 50 m (on
average 10.4%).
Savona Area
Data relative to meiofaunal composition, total
abundance, composition and number of taxa in
259
Table 3a,b. Meiofauna composition, abundance (ind/1 Ocm l ) and number of taxa: a Genova,
bSavona
Nematodes Copepods Polychaetes Ostracods Others- Total N"ofTaxa
a
G7B
752.2
153.1
20.4
11.5
20.3
957.2
9
G7C
1056.6
403.5
130.1
15.0
62.S
1668.0
8
G7D
402.7
17.7
4.4
0
2.7
427.5
6
GSB
1229.2
1160.2
46.9
95.6
10.6
2542.5
12
G8C
629.2
116.8
1.8
3.5
31.8
783.1
8
G8D
170.8
21.2
1.8
5.3
5.3
204.4
8
G9B
2581.4
993.8
52.2
41.6
59.3
3728.3
11
G9C
2433.6
336.3
42.5
20.4
112.3
2946.1
13
G9D
405.3
45.1
0.9
15.9
13.3
4S0.5
8
GlOB
882.3
139.8
13.3
5.3
18.6
1060.2
10
GIOC
3623.9
481.4
65.5
24.8
56.5
4252.1
12
G10D
910.6
151.3
8.9
2004
16.8
1108.0
9
b
SIB
3060.2
574.3
58.4
28.3
52.2
3773.4
12
SlC
714.2
54.0
8.8
4.4
11.0
789.4
8
S2B
772.6
386.7
51.3
23.0
45.1
1278.7
13
S2C
1569.0
1570.8
161.9
94.7
149.6
3546.0
12
S2D
81D.6
S3B
892.0
S3C
749.6
S3D
144.2
values at 50 m (on average 72.5 indlm 2 ), while
molluscs do not show a clear pattern with depth.
For both assemblages species number reaches
the top average value at 20 m (17 and 3 species
for molluscs and echinoderms respectively).
In front of Savona, Corbula gibba and
Thyasira Jlexuosa are found, but with much
lower abundances than at Genova.
Suspension-feeders dominate both at stations Band C, with average percentages of 82 and
55% respectively, while deposit-feeders reach the
top percentage at 50 m (45%).
Similar to Genova, diversity (H') and evenness 0) values were quite similar throughout the
investigated area.
Meiofauna Density, Structure
and Distribution
Genova Area
Data relative to meiofaunal composition, total
abundance and number of taxa in front of
243.4
17.7
16.8
46.9
1135.4
15
131.9
15.0
4.4
25.7
1069.0
10
166.4
21.2
12.4
24.8
974.4
11
16.8
1.8
0
6.2
169.0
8
Genova are showed in Table 3a. Meiofaunal
abundance ranges between 2412.4 indll0cm 2 (on
average at 20 m) and 555.1 indl1Ocm 2 (on average at 50 m). A generally increasing pattern is
observed moving from east to west (transect G7:
1017.7 indl1Ocm 2 on average; transect G9: 2385
indll0cm 2 on average).
Number of taxa decreases with depth and
from west to east, ranging between lIon average
at 10 m and 8 at 50 m depth and from 10.3 (transect GI0) to 7.6 (transect G7).
Nematodes constitute the most represented
taxon at all depths, followed by copepods.
Nematodes display an increasing pattern with
depth ranging on average from 65.4% (10 m) to
83.3% (SO m). By contrast, copepods percentage
decreases with depth: highest values are found at
10 m (on average 29.4%) and lowest at 50 m (on
average 10.4%).
Savona Area
Data relative to meiofaunal composition, total
abundance, composition and number of taxa in
259