

258
A. Covazzi Harriague et al.
ghtly lower than those observed at Genova: maximum values are observed at the shallowest and
deepest stations. A clear increasing pattern was
observed from east to west (0.06 mglg on average
at transect SI, 0.2 mglg on average at transect S3).
Mollusc and Echinoderm Density, Structure
and Distribution
Genova Area
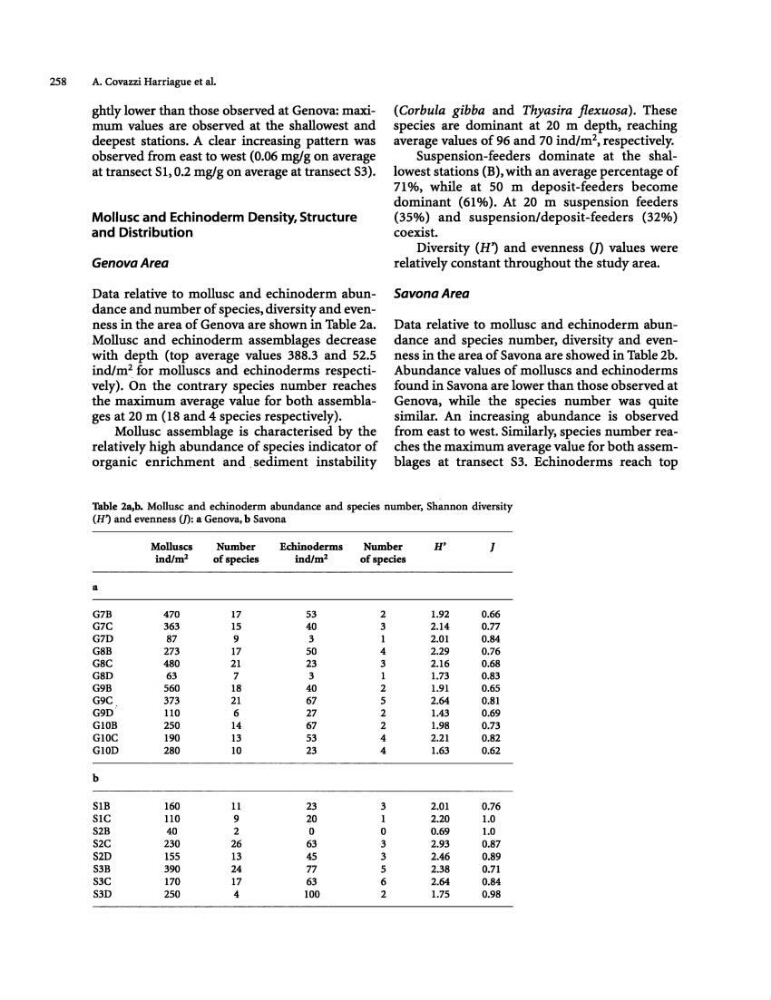
Data relative to mollusc and echinoderm abundance and number of species, diversity and evenness in the area of Genova are shown in Table 2a.
Mollusc and echinoderm assemblages decrease
with depth (top average values 388.3 and 52.5
indlm 2 for molluscs and echinoderms respectively). On the contrary species number reaches
the maximum average value for both assemblages at 20 m (18 and 4 species respectively).
Mollusc assemblage is characterised by the
relatively high abundance of species indicator of
organic enrichment and sediment instability
(Corbula gibba and Thyasira jlexuosa). These
species are dominant at 20 m depth, reaching
average values of 96 and 70 indlm 2 , respectively.
Suspension-feeders dominate at the shallowest stations (B), with an average percentage of
71 %, while at 50 m deposit-feeders become
dominant (61%). At 20 m suspension feeders
(35%) and suspension/deposit-feeders (32%)
coexist.
Diversity (H') and evenness m values were
relatively constant throughout the study area.
Savona Area
Data relative to mollusc and echinoderm abundance and species number, diversity and evenness in the area of Savona are showed in Table 2b.
Abundance values of molluscs and echinoderms
found in Savona are lower than those observed at
Genova, while the species number was quite
similar. An increasing abundance is observed
from east to west. Similarly, species number reaches the maximum average value for both assemblages at transect 53. Echinoderms reach top
Table 2a,b. Mollusc and echinoderm abundance and species number, Shannon diversity
(H') and evenness (J): a Genova, b Savona
a
G7B
G7C
G7D
GSB
G8C
G8D
G9B
G9C
G9D
GlOB
GlOC
GlOD
b
SIB
SIC
S2B
S2C
S2D
S3B
S3C
S3D
Molluscs
Number
indlm l
of species
470
17
363
15
87
9
273
17
480
21
63
7
560
18
373
21
110
6
250
14
190
13
280
10
160
11
110
9
40
2
230
26
155
13
390
24
170
17
250
4
Echinoderms
Number
H'
J
indlm l
of species
53
2
1.92
0.66
40
3
2.14
0.77
3
1
2.01
0.84
50
4
2.29
0.76
23
3
2.16
0.68
3
1
1.73
0.83
40
2
1.91
0.65
67
5
2.64
0.81
27
2
1.43
0.69
67
2
1.98
0.73
53
4
2.21
0.82
23
4
1.63
0.62
23
3
2.01
0.76
20
1
2.20
1.0
0
0
0.69
1.0
63
3
2.93
0.87
45
3
2.46
0.89
77
5
2.38
0.71
63
6
2.64
0.84
100
2
1.75
0.98
A. Covazzi Harriague et al.
ghtly lower than those observed at Genova: maximum values are observed at the shallowest and
deepest stations. A clear increasing pattern was
observed from east to west (0.06 mglg on average
at transect SI, 0.2 mglg on average at transect S3).
Mollusc and Echinoderm Density, Structure
and Distribution
Genova Area
Data relative to mollusc and echinoderm abundance and number of species, diversity and evenness in the area of Genova are shown in Table 2a.
Mollusc and echinoderm assemblages decrease
with depth (top average values 388.3 and 52.5
indlm 2 for molluscs and echinoderms respectively). On the contrary species number reaches
the maximum average value for both assemblages at 20 m (18 and 4 species respectively).
Mollusc assemblage is characterised by the
relatively high abundance of species indicator of
organic enrichment and sediment instability
(Corbula gibba and Thyasira jlexuosa). These
species are dominant at 20 m depth, reaching
average values of 96 and 70 indlm 2 , respectively.
Suspension-feeders dominate at the shallowest stations (B), with an average percentage of
71 %, while at 50 m deposit-feeders become
dominant (61%). At 20 m suspension feeders
(35%) and suspension/deposit-feeders (32%)
coexist.
Diversity (H') and evenness m values were
relatively constant throughout the study area.
Savona Area
Data relative to mollusc and echinoderm abundance and species number, diversity and evenness in the area of Savona are showed in Table 2b.
Abundance values of molluscs and echinoderms
found in Savona are lower than those observed at
Genova, while the species number was quite
similar. An increasing abundance is observed
from east to west. Similarly, species number reaches the maximum average value for both assemblages at transect 53. Echinoderms reach top
Table 2a,b. Mollusc and echinoderm abundance and species number, Shannon diversity
(H') and evenness (J): a Genova, b Savona
a
G7B
G7C
G7D
GSB
G8C
G8D
G9B
G9C
G9D
GlOB
GlOC
GlOD
b
SIB
SIC
S2B
S2C
S2D
S3B
S3C
S3D
Molluscs
Number
indlm l
of species
470
17
363
15
87
9
273
17
480
21
63
7
560
18
373
21
110
6
250
14
190
13
280
10
160
11
110
9
40
2
230
26
155
13
390
24
170
17
250
4
Echinoderms
Number
H'
J
indlm l
of species
53
2
1.92
0.66
40
3
2.14
0.77
3
1
2.01
0.84
50
4
2.29
0.76
23
3
2.16
0.68
3
1
1.73
0.83
40
2
1.91
0.65
67
5
2.64
0.81
27
2
1.43
0.69
67
2
1.98
0.73
53
4
2.21
0.82
23
4
1.63
0.62
23
3
2.01
0.76
20
1
2.20
1.0
0
0
0.69
1.0
63
3
2.93
0.87
45
3
2.46
0.89
77
5
2.38
0.71
63
6
2.64
0.84
100
2
1.75
0.98