

126
P. Rossini et a1
a 120,-----,---.,...-----,
100 ... . .... ,"'" .... '~. ., .. ,,,, ... ""., ...... ".,,"
1r.1 80 ................ ""! ........... H • • • • ( • • • • • • • •
'tS 60 ................... , ..................... i ........ .
~
:
.
,..c 40 ........ " ...... j "·l······ . . . . ' -. . . . " 31.7 '"
p..,
,
:
D
20].;'"'' ';' ''',; " ... ~' ,
O"H'~' , '
' i '
AGIP
Cesenatico
Venezia
b
100
1r.1
80
"'s
60
gf 40
=
U 20
0
AGIP
Cesenatico
:::r: Max
Min
c::::::J 75%
25%
D
Median
:::r: Max
Min
c::::::J 75%
25%
D
Median
4~--~----------~
3 " ... "",, ""H
. . . . . . . . . . , , , . . . . '"f'''''
1m~~ m,' E, ; . [~r
0· .. · .... " .... ,
2 ....... , ,
AGIP
Cesenatico
Venez~
16 '
1r.1
('II
12 .".n .................. )."." ...... ,"" •• , . . ,.} •.• ",
:j :~I~I7!
AGIP
Cesenatico
Venezia
:::r: Max
Min
c
c::::::J 75%
25%
D
Median
:::r: Max
Min
d
c::::::J 75%
25%
a Median
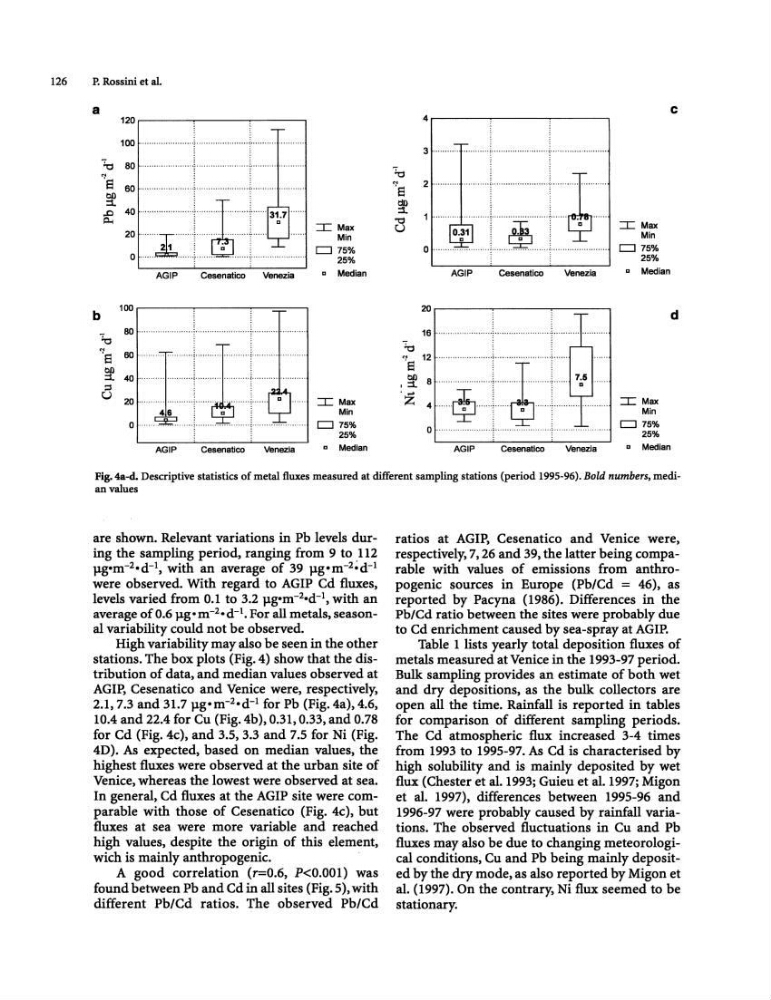
Fig.4a-d. Descriptive statistics of metal fluxes measured at different sampling stations (period 1995-96). Bold numbers, median values
are shown. Relevant variations in Pb levels during the sampling period, ranging from 9 to .112
p.g o m- 2o d-1, with an average of 39 p.g"m- 2 ·d- 1
were observed. With regard to AGIP Cd fluxes,
levels varied from 0.1 to 3.2 p.g o m- zo d-l, with an
average of 0.6 p.g. m- z • d- 1 • For all metals, seasonal variability could not be observed.
High variability may also be seen in the other
stations. The box plots (Fig. 4) show that the distribution of data, and median values observed at
AGIP, Cesenatico and Venice were, respectively.
2.1,7.3 and 31.7 p.g"m- 2 ·d- 1 for Pb (Fig. 4a), 4.6,
lOA and 22.4 for Cu (Fig. 4b), 0.31, 0.33, and 0.78
for Cd (Fig. 4c), and 3.5, 3.3 and 7.5 for Ni (Fig.
4D). As expected, based on median values, the
highest fluxes were observed at the urban site of
Venice, whereas the lowest were observed at sea.
In general, Cd fluxes at the AGIP site were comparable with those of Cesenatico (Fig. 4c), but
fluxes at sea were more variable and reached
high values, despite the origin of this element.
wich is mainly anthropogenic.
A good correlation (r=0.6, P
different Pb/Cd ratios. The observed Pb/Cd
ratios at AGIP, Cesenatico and Venice were.
respectively. 7, 26 and 39, the latter being comparable with values of emissions from anthropogenic sources in Europe (Pb/Cd = 46), as
reported by Pacyna (1986). Differences in the
Pb/Cd ratio between the sites were probably due
to Cd enrichment caused by sea-spray at AGIP.
Table 1 lists yearly total deposition fluxes of
metals measured at Venice in the 1993-97 period.
Bulk sampling provides an estimate of both wet
and dry depositions. as the bulk collectors are
open all the time. Rainfall is reported in tables
for comparison of different sampling periods.
The Cd atmospheric flux increased 3-4 times
from 1993 to 1995-97. As Cd is characterised by
high solubility and is mainly deposited by wet
flux (Chester et al.1993; Guieu et al. 1997; Migon
et al. 1997), differences between 1995-96 and
1996-97 were probably caused by rainfall variations. The observed fluctuations in eu and Pb
fluxes may also be due to changing meteorological conditions, Cu and Pb being mainly deposited by the dry mode, as also reported by Migon et
al. (1997). On the contrary. Ni flux seemed to be
stationary.
P. Rossini et a1
a 120,-----,---.,...-----,
100 ... . .... ,"'" .... '~. ., .. ,,,, ... ""., ...... ".,,"
1r.1 80 ................ ""! ........... H • • • • ( • • • • • • • •
'tS 60 ................... , ..................... i ........ .
~
:
.
,..c 40 ........ " ...... j "·l······ . . . . ' -. . . . " 31.7 '"
p..,
,
:
D
20].;'"'' ';' ''',; " ... ~' ,
O"H'~' , '
' i '
AGIP
Cesenatico
Venezia
b
100
1r.1
80
"'s
60
gf 40
=
U 20
0
AGIP
Cesenatico
:::r: Max
Min
c::::::J 75%
25%
D
Median
:::r: Max
Min
c::::::J 75%
25%
D
Median
4~--~----------~
3 " ... "",, ""H
. . . . . . . . . . , , , . . . . '"f'''''
1m~~ m,' E, ; . [~r
0· .. · .... " .... ,
2 ....... , ,
AGIP
Cesenatico
Venez~
16 '
1r.1
('II
12 .".n .................. )."." ...... ,"" •• , . . ,.} •.• ",
:j :~I~I7!
AGIP
Cesenatico
Venezia
:::r: Max
Min
c
c::::::J 75%
25%
D
Median
:::r: Max
Min
d
c::::::J 75%
25%
a Median
Fig.4a-d. Descriptive statistics of metal fluxes measured at different sampling stations (period 1995-96). Bold numbers, median values
are shown. Relevant variations in Pb levels during the sampling period, ranging from 9 to .112
p.g o m- 2o d-1, with an average of 39 p.g"m- 2 ·d- 1
were observed. With regard to AGIP Cd fluxes,
levels varied from 0.1 to 3.2 p.g o m- zo d-l, with an
average of 0.6 p.g. m- z • d- 1 • For all metals, seasonal variability could not be observed.
High variability may also be seen in the other
stations. The box plots (Fig. 4) show that the distribution of data, and median values observed at
AGIP, Cesenatico and Venice were, respectively.
2.1,7.3 and 31.7 p.g"m- 2 ·d- 1 for Pb (Fig. 4a), 4.6,
lOA and 22.4 for Cu (Fig. 4b), 0.31, 0.33, and 0.78
for Cd (Fig. 4c), and 3.5, 3.3 and 7.5 for Ni (Fig.
4D). As expected, based on median values, the
highest fluxes were observed at the urban site of
Venice, whereas the lowest were observed at sea.
In general, Cd fluxes at the AGIP site were comparable with those of Cesenatico (Fig. 4c), but
fluxes at sea were more variable and reached
high values, despite the origin of this element.
wich is mainly anthropogenic.
A good correlation (r=0.6, P
different Pb/Cd ratios. The observed Pb/Cd
ratios at AGIP, Cesenatico and Venice were.
respectively. 7, 26 and 39, the latter being comparable with values of emissions from anthropogenic sources in Europe (Pb/Cd = 46), as
reported by Pacyna (1986). Differences in the
Pb/Cd ratio between the sites were probably due
to Cd enrichment caused by sea-spray at AGIP.
Table 1 lists yearly total deposition fluxes of
metals measured at Venice in the 1993-97 period.
Bulk sampling provides an estimate of both wet
and dry depositions. as the bulk collectors are
open all the time. Rainfall is reported in tables
for comparison of different sampling periods.
The Cd atmospheric flux increased 3-4 times
from 1993 to 1995-97. As Cd is characterised by
high solubility and is mainly deposited by wet
flux (Chester et al.1993; Guieu et al. 1997; Migon
et al. 1997), differences between 1995-96 and
1996-97 were probably caused by rainfall variations. The observed fluctuations in eu and Pb
fluxes may also be due to changing meteorological conditions, Cu and Pb being mainly deposited by the dry mode, as also reported by Migon et
al. (1997). On the contrary. Ni flux seemed to be
stationary.