

Results and Discussion
Atmospheric Fluxes
As bulk collectors are open all the time, the
amount of collected water is variable, being
affected by evaporation due to weather conditions (e.g. dryness or high humidity). As the element concentrations of samples could not be
compared, deposition fluxes in J.1g. m- 2 had to be
computed. Fluxes (P., J.1g·m- 2 ) were calculated
according to the following equation:
120
100
.... I
"
80
~
E 60
CJ)
:::2.
.c 40
D..
20
0
Venezia 1995-96
6 c I
N
N
o
CD
"'C
I
T""
N
.c
~
to
N
Atmospheric Deposition of Metals in North Adriatic Sea
125
CxVxV I
F =
c
r
S
"
V
a
I
where C is the element value in J.1ga mI- 1 , Vc is the
volume of digested solution expressed as mI, V, is
the amount of collected rain (mI). VI is the concentrated volume of the sample (mI), and Sa is the
sampler surface area (0.140 m l ).
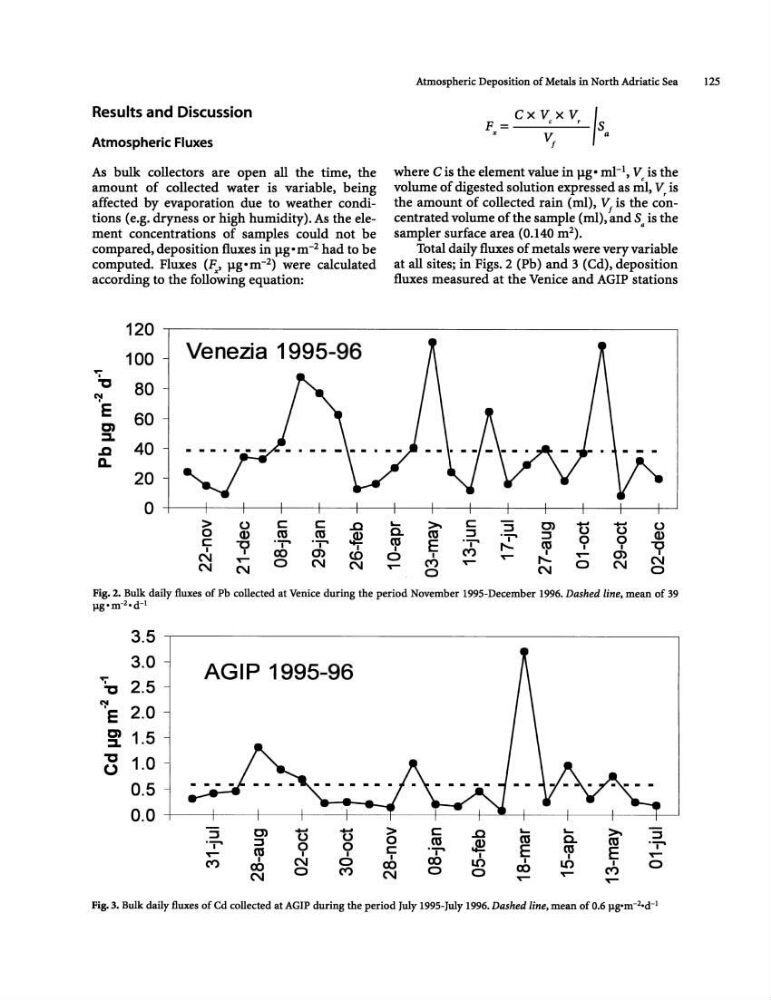
Total daily fluxes of metals were very variable
at all sites; in Figs, 2 (Pb) and 3 (Cd), deposition
fluxes measured at the Venice and AGIP stations
>as
E I
('I)
o
1:)
9
T""
o
1:)
o I
0)
N
o
CD
V
N
o
Fig. 2. Bulk daily fluxes of Pb collected at Venice during the period November 1995-December 1996. Dashed line, mean of 39
jlg'm- 2 • d- 1
3.5
3.0
AGIP 1995-96
"i'
"
2.5
"\I
2.0
E
CJ)
1.5
:::L
"'Cl
1.0
0
0.5
0.0
:::s
C)
1:)
1:)
>
c
..c
....
....
>:::s
'T"
:::s
0
0
0
as
~
as
Q.
as
'T"
as
C
'T"
E
as
E
T""
I
I
,
I
T""
('I)
, N
0
CO
CO
LO
I
LO
I
0
CO
0
('I)
N
0
0
CO
('I)
N
T""
T""
...Fig. 3. Bulk daily fluxes of Cd collected at AGIP during the period July 1995-July 1996. Dashed line. mean of 0.6 jlg·m- 2 ·d- 1
Atmospheric Fluxes
As bulk collectors are open all the time, the
amount of collected water is variable, being
affected by evaporation due to weather conditions (e.g. dryness or high humidity). As the element concentrations of samples could not be
compared, deposition fluxes in J.1g. m- 2 had to be
computed. Fluxes (P., J.1g·m- 2 ) were calculated
according to the following equation:
120
100
.... I
"
80
~
E 60
CJ)
:::2.
.c 40
D..
20
0
Venezia 1995-96
6 c I
N
N
o
CD
"'C
I
T""
N
.c
~
to
N
Atmospheric Deposition of Metals in North Adriatic Sea
125
CxVxV I
F =
c
r
S
"
V
a
I
where C is the element value in J.1ga mI- 1 , Vc is the
volume of digested solution expressed as mI, V, is
the amount of collected rain (mI). VI is the concentrated volume of the sample (mI), and Sa is the
sampler surface area (0.140 m l ).
Total daily fluxes of metals were very variable
at all sites; in Figs, 2 (Pb) and 3 (Cd), deposition
fluxes measured at the Venice and AGIP stations
>as
E I
('I)
o
1:)
9
T""
o
1:)
o I
0)
N
o
CD
V
N
o
Fig. 2. Bulk daily fluxes of Pb collected at Venice during the period November 1995-December 1996. Dashed line, mean of 39
jlg'm- 2 • d- 1
3.5
3.0
AGIP 1995-96
"i'
"
2.5
"\I
2.0
E
CJ)
1.5
:::L
"'Cl
1.0
0
0.5
0.0
:::s
C)
1:)
1:)
>
c
..c
....
....
>:::s
'T"
:::s
0
0
0
as
~
as
Q.
as
'T"
as
C
'T"
E
as
E
T""
I
I
,
I
T""
('I)
, N
0
CO
CO
LO
I
LO
I
0
CO
0
('I)
N
0
0
CO
('I)
N
T""
T""
...Fig. 3. Bulk daily fluxes of Cd collected at AGIP during the period July 1995-July 1996. Dashed line. mean of 0.6 jlg·m- 2 ·d- 1