

120
M. Mingazzini
region seems to be unlikely since we dearly
found the riverine DOM spectral features (Fig. 4,
Station Po) unchanged in the marine Stations 1
to 6. On the other hand, the EOM production,
which could explain the missing of a dilution
trend, can not be detected using DOC measurements, which are unable to distinguish or trace it.
Natural Phytoplankton EOM
While fluorescence measurements performed on
different estuaries over the world confIrm the
effectiveness of the fluorescence parameter - Ex
max in the visible region - to describe the terres=i
u.:
~
co z
~
~
A
8
w
o
z
w
o
U)
w
n::
0:::l
...J
1L
~ _ _ ../_ 39
~_--.I: 35
25
~~--/18
_-_-_-_-_-_--/--'11
days
~-~--~-_,--~~----f06
258
388
358
488
458
588 Ex nm
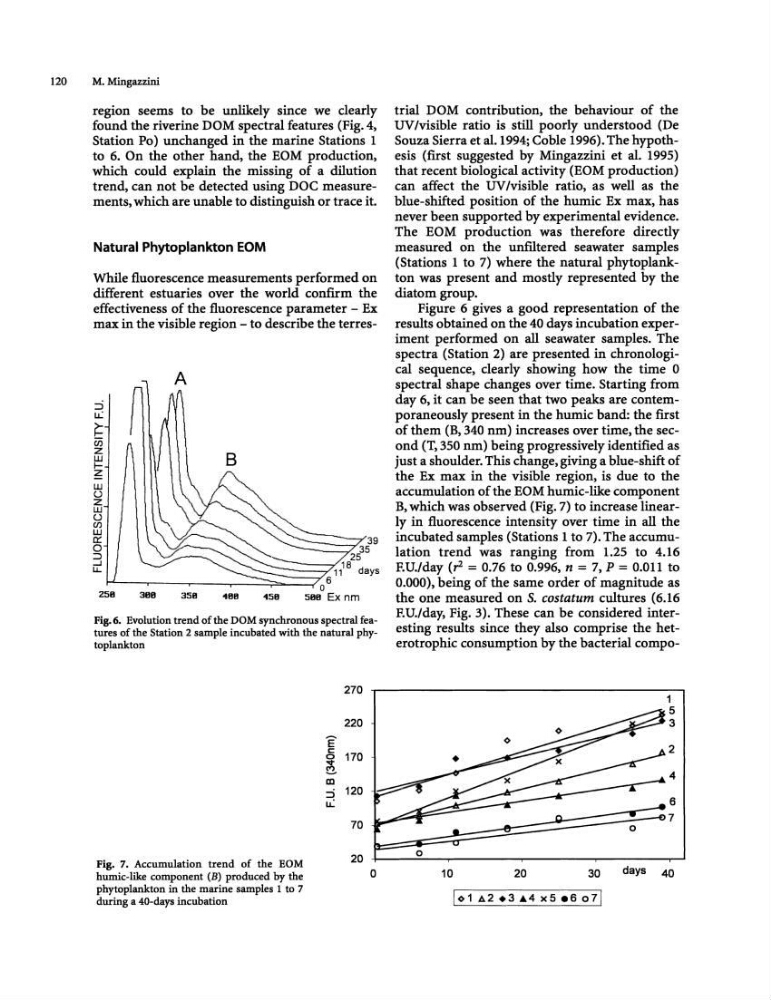
Fig.6. Evolution trend of the DaM synchronous spectral features of the Station 2 sample incubated with the natural phytoplankton
Fig. 7. Accumulation trend of the EOM
humic-like component (B) produced by the
phytoplankton in the marine samples 1 to 7
during a 40-days incubation
E c:
0
~
CD
=i
u.:
270
220
170
120
70
20
0
trial DOM contribution, the behaviour of the
UV/visible ratio is still poorly understood (De
Souza Sierra et al. 1994; Coble 1996). The hypothesis (first suggested by Mingazzini et al. 1995)
that recent biological activity (EOM production)
can affect the UV Ivisible ratio, as well as the
blue-shifted position of the humic Ex max, has
never been supported by experimental evidence.
The EOM production was therefore directly
measured on the unfiltered seawater samples
(Stations 1 to 1) where the natural phytoplankton was present and mostly represented by the
diatom group.
Figure 6 gives a good representation of the
results obtained on the 40 days incubation experiment performed on all seawater samples. The
spectra (Station 2) are presented in chronological sequence, dearly showing how the time 0
spectral shape changes over time. Starting from
day 6, it can be seen that two peaks are contemporaneously present in the humic band: the first
of them (B, 340 nm) increases over time, the second (T,350 nm) being progressively identified as
just a shoulder. This change, giving a blue-shift of
the Ex max in the visible region, is due to the
accumulation of the EOM humic-like component
B, which was observed (Fig. 7) to increase linearly in fluorescence intensity over time in all the
incubated samples (Stations 1 to 7). The accumulation trend was ranging from 1.25 to 4.16
EU./day (rZ = 0.76 to 0.996, n = 7, P = 0.011 to
0.000), being of the same order of magnitude as
the one measured on S. costatum cultures (6.16
EU./day, Fig. 3). These can be considered interesting results since they also comprise the heterotrophic consumption by the bacterial compoo
10
20
30
days 40
M. Mingazzini
region seems to be unlikely since we dearly
found the riverine DOM spectral features (Fig. 4,
Station Po) unchanged in the marine Stations 1
to 6. On the other hand, the EOM production,
which could explain the missing of a dilution
trend, can not be detected using DOC measurements, which are unable to distinguish or trace it.
Natural Phytoplankton EOM
While fluorescence measurements performed on
different estuaries over the world confIrm the
effectiveness of the fluorescence parameter - Ex
max in the visible region - to describe the terres=i
u.:
~
co z
~
~
A
8
w
o
z
w
o
U)
w
n::
0:::l
...J
1L
~ _ _ ../_ 39
~_--.I: 35
25
~~--/18
_-_-_-_-_-_--/--'11
days
~-~--~-_,--~~----f06
258
388
358
488
458
588 Ex nm
Fig.6. Evolution trend of the DaM synchronous spectral features of the Station 2 sample incubated with the natural phytoplankton
Fig. 7. Accumulation trend of the EOM
humic-like component (B) produced by the
phytoplankton in the marine samples 1 to 7
during a 40-days incubation
E c:
0
~
CD
=i
u.:
270
220
170
120
70
20
0
trial DOM contribution, the behaviour of the
UV/visible ratio is still poorly understood (De
Souza Sierra et al. 1994; Coble 1996). The hypothesis (first suggested by Mingazzini et al. 1995)
that recent biological activity (EOM production)
can affect the UV Ivisible ratio, as well as the
blue-shifted position of the humic Ex max, has
never been supported by experimental evidence.
The EOM production was therefore directly
measured on the unfiltered seawater samples
(Stations 1 to 1) where the natural phytoplankton was present and mostly represented by the
diatom group.
Figure 6 gives a good representation of the
results obtained on the 40 days incubation experiment performed on all seawater samples. The
spectra (Station 2) are presented in chronological sequence, dearly showing how the time 0
spectral shape changes over time. Starting from
day 6, it can be seen that two peaks are contemporaneously present in the humic band: the first
of them (B, 340 nm) increases over time, the second (T,350 nm) being progressively identified as
just a shoulder. This change, giving a blue-shift of
the Ex max in the visible region, is due to the
accumulation of the EOM humic-like component
B, which was observed (Fig. 7) to increase linearly in fluorescence intensity over time in all the
incubated samples (Stations 1 to 7). The accumulation trend was ranging from 1.25 to 4.16
EU./day (rZ = 0.76 to 0.996, n = 7, P = 0.011 to
0.000), being of the same order of magnitude as
the one measured on S. costatum cultures (6.16
EU./day, Fig. 3). These can be considered interesting results since they also comprise the heterotrophic consumption by the bacterial compoo
10
20
30
days 40