

Synchronous Fluorescence Spectra as Chemical Tracers of North Adriatic DOM
119
A
::i
u.:
~
a;
T
z
LU
I~
LU
U
Z
LU
U
(f)
LU
cr.:
Po
0
1 3
::J
5
...J
4 2 Stations
lL
6
7
258
388
358
18B
158
588
Exnm
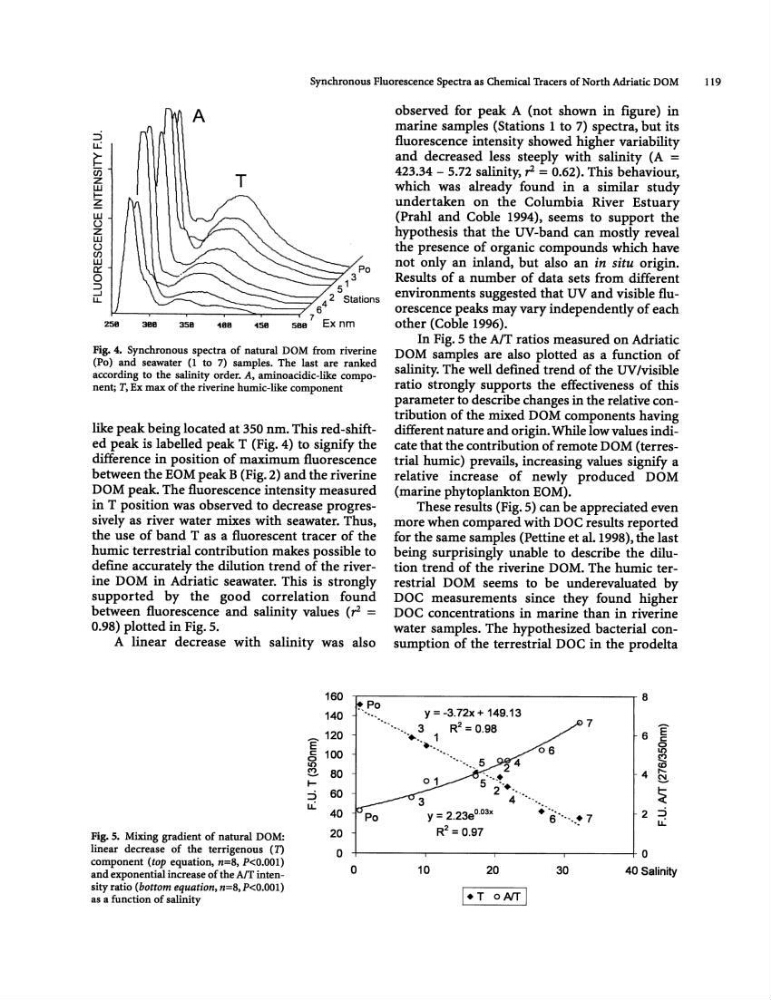
Fig. 4. Synchronous spectra of natural DOM from riverine
(Po) and seawater (1 to 7) samples. The last are ranked
according to the salinity order. A, amino acidic-like compo·
nent; T, Ex max of the riverine humic-like component
like peak being located at 350 nm. This red-shifted peak is labelled peak T (Fig. 4) to signify the
difference in position of maximum fluorescence
between the EOM peak B (Fig. 2) and the riverine
DOM peak. The fluorescence intensity measured
in T position was observed to decrease progressively as river water mixes with seawater. Thus,
the use of band T as a fluorescent tracer of the
humic terrestrial contribution makes possible to
define accurately the dilution trend of the riverine DOM in Adriatic seawater. This is strongly
supported by the good correlation found
between fluorescence and salinity values (r2 =
0.98) plotted in Fig. 5.
A linear decrease with salinity was also
observed for peak A (not shown in figure) in
marine samples (Stations 1 to 7) spectra, but its
fluorescence intensity showed higher variability
and decreased less steeply with salinity (A =
423.34 - 5.72 salinity, r2 = 0.62). This behaviour,
which was already found in a similar study
undertaken on the Columbia River Estuary
(Prahl and Coble 1994), seems to support the
hypothesis that the UV-band can mostly reveal
the presence of organic compounds which have
not only an inland, but also an in situ origin.
Results of a number of data sets from different
environments suggested that UV and visible fluorescence peaks may vary independently of each
other (Coble 1996).
In Fig. 5 the AfT ratios measured on Adriatic
DOM samples are also plotted as a function of
salinity. The well defined trend of the UV Ivisible
ratio strongly supports the effectiveness of this
parameter to describe changes in the relative contribution of the mixed DOM components having
different nature and origin. While low values indicate that the contribution of remote DOM (terrestrial humic) prevails, increasing values signify a
relative increase of newly produced DOM
(marine phytoplankton EOM).
These results (Fig. 5) can be appreciated even
more when compared with DOC results reported
for the same samples (Pettine et al. 1998), the last
being surprisingly unable to describe the dilution trend of the riverine DOM. The humic terrestrial DOM seems to be underevaluated by
DOC measurements since they found higher
DOC concentrations in marine than in riverine
water samples. The hypothesized bacterial consumption of the terrestrial DOC in the prodelta
8
160
140
...... 120
E
~,Po
•
y = -3.72x + 149.13
........... 3
R" = 0.98
7
Fig. 5. Mixing gradient of natural DOM:
linear decrease of the terrigenous (n
component (top equation, n=8, P
sity ratio (bottom equation, n==8,P
~_ 100
- 80
::i 60
u.: 40
20
o
Po
o
..... 1
....
3
..... ~
<0'''' ....
'""""''''
Y = 2.23eo. 03x
R2 = 0.97
6 E c
0
U)
~
4 r-~
~
2 ::j
u:
' ."' "
6 ..... ~ 7
0
30
40 Salinity
119
A
::i
u.:
~
a;
T
z
LU
I~
LU
U
Z
LU
U
(f)
LU
cr.:
Po
0
1 3
::J
5
...J
4 2 Stations
lL
6
7
258
388
358
18B
158
588
Exnm
Fig. 4. Synchronous spectra of natural DOM from riverine
(Po) and seawater (1 to 7) samples. The last are ranked
according to the salinity order. A, amino acidic-like compo·
nent; T, Ex max of the riverine humic-like component
like peak being located at 350 nm. This red-shifted peak is labelled peak T (Fig. 4) to signify the
difference in position of maximum fluorescence
between the EOM peak B (Fig. 2) and the riverine
DOM peak. The fluorescence intensity measured
in T position was observed to decrease progressively as river water mixes with seawater. Thus,
the use of band T as a fluorescent tracer of the
humic terrestrial contribution makes possible to
define accurately the dilution trend of the riverine DOM in Adriatic seawater. This is strongly
supported by the good correlation found
between fluorescence and salinity values (r2 =
0.98) plotted in Fig. 5.
A linear decrease with salinity was also
observed for peak A (not shown in figure) in
marine samples (Stations 1 to 7) spectra, but its
fluorescence intensity showed higher variability
and decreased less steeply with salinity (A =
423.34 - 5.72 salinity, r2 = 0.62). This behaviour,
which was already found in a similar study
undertaken on the Columbia River Estuary
(Prahl and Coble 1994), seems to support the
hypothesis that the UV-band can mostly reveal
the presence of organic compounds which have
not only an inland, but also an in situ origin.
Results of a number of data sets from different
environments suggested that UV and visible fluorescence peaks may vary independently of each
other (Coble 1996).
In Fig. 5 the AfT ratios measured on Adriatic
DOM samples are also plotted as a function of
salinity. The well defined trend of the UV Ivisible
ratio strongly supports the effectiveness of this
parameter to describe changes in the relative contribution of the mixed DOM components having
different nature and origin. While low values indicate that the contribution of remote DOM (terrestrial humic) prevails, increasing values signify a
relative increase of newly produced DOM
(marine phytoplankton EOM).
These results (Fig. 5) can be appreciated even
more when compared with DOC results reported
for the same samples (Pettine et al. 1998), the last
being surprisingly unable to describe the dilution trend of the riverine DOM. The humic terrestrial DOM seems to be underevaluated by
DOC measurements since they found higher
DOC concentrations in marine than in riverine
water samples. The hypothesized bacterial consumption of the terrestrial DOC in the prodelta
8
160
140
...... 120
E
~,Po
•
y = -3.72x + 149.13
........... 3
R" = 0.98
7
Fig. 5. Mixing gradient of natural DOM:
linear decrease of the terrigenous (n
component (top equation, n=8, P
sity ratio (bottom equation, n==8,P
~_ 100
- 80
::i 60
u.: 40
20
o
Po
o
..... 1
....
3
..... ~
<0'''' ....
'""""''''
Y = 2.23eo. 03x
R2 = 0.97
6 E c
0
U)
~
4 r-~
~
2 ::j
u:
' ."' "
6 ..... ~ 7
0
30
40 Salinity