

118
M. Mingazzini
::i
u.:
~
U5
Z
ill
l-~
ill
(J
Z
ill
<.)
(/)
ill
0::
o
:::::l
-I
u..
A
B
3
,
SpecIes
~~--~----~--~--~~--~1
388
358
"188
158
588 Ex nm
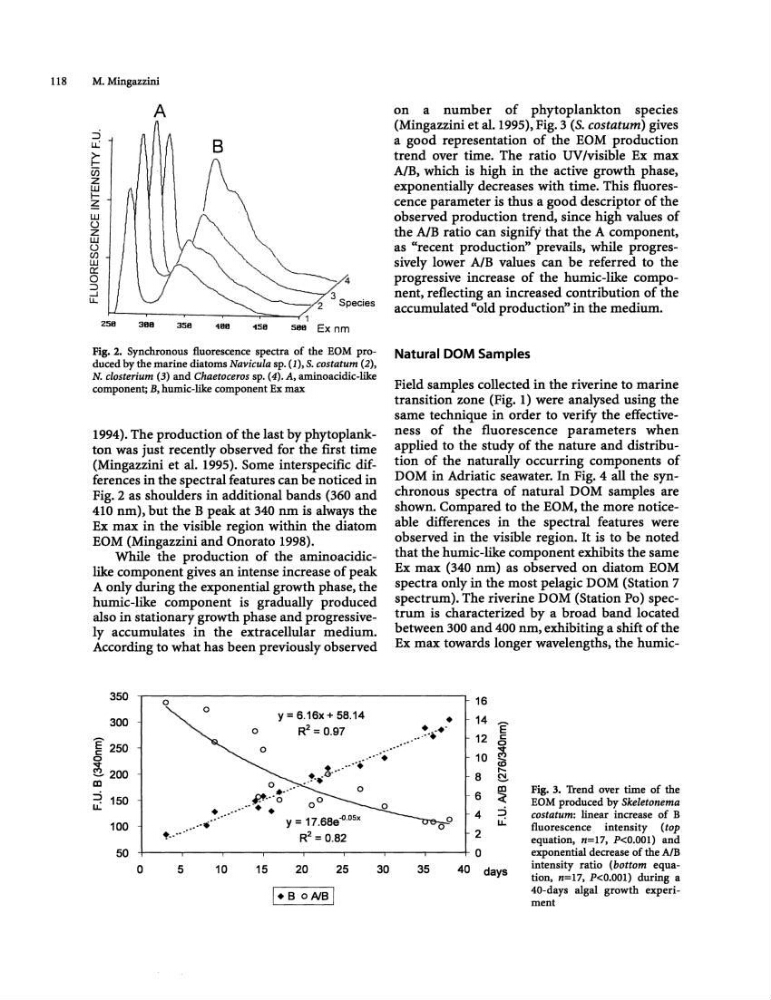
Fig. 2. Synchronous fluorescence spectra of the EOM produced by the marine diatoms Navicula sp. (1), S. costatum (2),
N. closterium (3) and Chaetoceros sp. (4). A, aminoacldic-like
component; B, humic-like component Ex max
1994). The production of the last by phytoplankton was just recently observed for the first time
(Mingazzini et al. 1995). Some interspecific differences in the spectral features can be noticed in
Fig. 2 as shoulders in additional bands (360 and
410 nm), but the B peak at 340 nm is always the
Ex max in the visible region within the diatom
EOM (Mingazzini and Onorato 1998).
While the production of the aminoaddiclike component gives an intense increase of peak
A only during the exponential growth phase, the
humic-like component is gradually produced
also in stationary growth phase and progressively accumulates in the extracellular medium.
According to what has been previously observed
350
300
' W250
o
~ 200
m
::i 150
u.:
100
50
o
y=6.16x+58.14
o
R2 = 0,97
o
0 •...•
~···o
•........•.
••.••....
y = 17.SBe.(l,osJ<
f······
R2 = 0,82
on a number of phytoplankton species
(Mingazzini et a1. 1995), Fig. 3 (S. costatum) gives
a good representation of the EOM production
trend over time. The ratio UV Ivisible Ex max
AlB. which is high in the active growth phase,
exponentially decreases with time. This fluorescence parameter is thus a good descriptor of the
observed production trend, since high values of
the AlB ratio can signify that the A component,
as "recent production" prevails, while progressively lower AlB values can be referred to the
progressive increase of the humic-like component, reflecting an increased contribution of the
accumulated "old production" in the medium.
Natural DOM Samples
Field samples collected in the riverine to marine
transition zone (Fig. 1) were analysed using the
same technique in order to verify the effectiveness of the fluorescence parameters when
applied to the study of the nature and distribution of the naturally occurring components of
DOM in Adriatic seawater. In Fig. 4 all the synchronous spectra of natural DOM samples are
shown. Compared to the EOM, the more noticeable differences in the spectral features were
observed in the visible region. It is to be noted
that the humic-like component exhibits the same
Ex max (340 nm) as observed on diatom EOM
spectra only in the most pelagic DOM (Station 7
spectrum). The riverine DOM (Station Po) spectrum is characterized by a broad band located
between 300 and 400 nm. exhibiting a shift of the
Ex max towards longer wavelengths, the humic•
• • ••
,.,.
16
14
12
10
8
6
4
2
0
E c
0
"It
(")
(0
r-..
~
~
:::)
u.:
o
5
10
15
20
25
30
35
40 days
Fig. 3. Trend over time of the
EOM produced by Skeletonema
costatum: linear increase of B
fluorescence intensity (top
equation, n=17, P
intensity ratio (bottom equation, n=17, P
M. Mingazzini
::i
u.:
~
U5
Z
ill
l-~
ill
(J
Z
ill
<.)
(/)
ill
0::
o
:::::l
-I
u..
A
B
3
,
SpecIes
~~--~----~--~--~~--~1
388
358
"188
158
588 Ex nm
Fig. 2. Synchronous fluorescence spectra of the EOM produced by the marine diatoms Navicula sp. (1), S. costatum (2),
N. closterium (3) and Chaetoceros sp. (4). A, aminoacldic-like
component; B, humic-like component Ex max
1994). The production of the last by phytoplankton was just recently observed for the first time
(Mingazzini et al. 1995). Some interspecific differences in the spectral features can be noticed in
Fig. 2 as shoulders in additional bands (360 and
410 nm), but the B peak at 340 nm is always the
Ex max in the visible region within the diatom
EOM (Mingazzini and Onorato 1998).
While the production of the aminoaddiclike component gives an intense increase of peak
A only during the exponential growth phase, the
humic-like component is gradually produced
also in stationary growth phase and progressively accumulates in the extracellular medium.
According to what has been previously observed
350
300
' W250
o
~ 200
m
::i 150
u.:
100
50
o
y=6.16x+58.14
o
R2 = 0,97
o
0 •...•
~···o
•........•.
••.••....
y = 17.SBe.(l,osJ<
f······
R2 = 0,82
on a number of phytoplankton species
(Mingazzini et a1. 1995), Fig. 3 (S. costatum) gives
a good representation of the EOM production
trend over time. The ratio UV Ivisible Ex max
AlB. which is high in the active growth phase,
exponentially decreases with time. This fluorescence parameter is thus a good descriptor of the
observed production trend, since high values of
the AlB ratio can signify that the A component,
as "recent production" prevails, while progressively lower AlB values can be referred to the
progressive increase of the humic-like component, reflecting an increased contribution of the
accumulated "old production" in the medium.
Natural DOM Samples
Field samples collected in the riverine to marine
transition zone (Fig. 1) were analysed using the
same technique in order to verify the effectiveness of the fluorescence parameters when
applied to the study of the nature and distribution of the naturally occurring components of
DOM in Adriatic seawater. In Fig. 4 all the synchronous spectra of natural DOM samples are
shown. Compared to the EOM, the more noticeable differences in the spectral features were
observed in the visible region. It is to be noted
that the humic-like component exhibits the same
Ex max (340 nm) as observed on diatom EOM
spectra only in the most pelagic DOM (Station 7
spectrum). The riverine DOM (Station Po) spectrum is characterized by a broad band located
between 300 and 400 nm. exhibiting a shift of the
Ex max towards longer wavelengths, the humic•
• • ••
,.,.
16
14
12
10
8
6
4
2
0
E c
0
"It
(")
(0
r-..
~
~
:::)
u.:
o
5
10
15
20
25
30
35
40 days
Fig. 3. Trend over time of the
EOM produced by Skeletonema
costatum: linear increase of B
fluorescence intensity (top
equation, n=17, P
intensity ratio (bottom equation, n=17, P