

Synchronous Fluorescence Spectra as Chemical Tracers of North Adriatic DOM
121
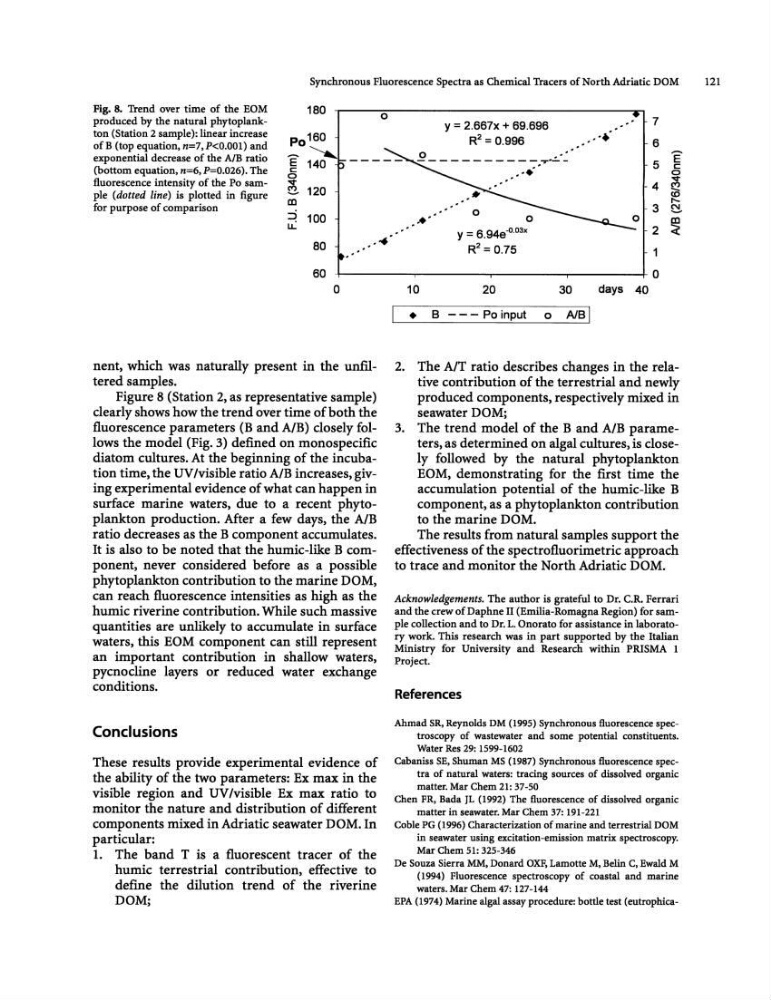
Fig. 8. Trend over time of the EOM
180
0
produced by the natural phytoplankton (Station 2 sample): linear increase
Po160
oCB (top equation, n=7,P
E
(bottom equation, n=6, P=O.026). The
c:
0
fluorescence intensity of the Po sam~ 120
pIe (dotted line) ill plotted in figure
a:l
for purpose of comparison
::j 100
u.:
80
...
60
0
nent, which was naturally present in the unfiltered samples.
Figure 8 (Station 2. as representative sample)
clearly shows how the trend over time of both the
fluorescence parameters (B and AlB) closely follows the model (Fig. 3) defIned on monospecifIc
diatom cultures. At the beginning of the incubation time, the UV lvisible ratio AlB increases, giving experimental evidence of what can happen in
surface marine waters, due to a recent phytoplankton production. After a few days, the AlB
ratio decreases as the B component accumulates.
It is also to be noted that the humic-like B component, never considered before as a possible
phytoplankton contribution to the marine DOM,
can reach fluorescence intensities as high as the
humic riverine contribution. While such massive
quantities are unlikely to accumulate in surface
waters, this EOM component can still represent
an important contribution in shallow waters,
pycnocline layers or reduced water exchange
conditions.
Conclusions
These results provide experimental evidence of
the ability of the two parameters: Ex max in the
visible region and UV lvisible Ex max ratio to
monitor the nature and distribution of different
components mixed in Adriatic seawater DOM. In
particular:
1. The band T is a fluorescent tracer of the
humic terrestrial contribution, effective to
defme the dilution trend of the riverine
DOM;
,
y = 2,667x + 69.696
7
R2 = 0.996
.' ,.' 6
5
E
, ,.'
c:
0
..,.
4 ~
(Q
r-3 N
0
--. . '
III
y = 6.94e- o . oax
2 <
R2 = 0.75
1
0
10
20
30
days 40
•
B - - - Po input 0 AlBJ
2. The AIT ratio describes changes in the relative contribution of the terrestrial and newly
produced components, respectively mixed in
seawater DOM;
3. The trend model of the B and AlB parameters, as determined on algal cultures, is closely followed by the natural phytoplankton
EOM. demonstrating for the fIrst time the
accumulation potential of the humic-like B
component, as a phytoplankton contribution
to the marine DOM.
The results from natural samples support the
effectiveness of the spectrofluorimetric approach
to trace and monitor the North Adriatic DOM.
Acknowledgements. The author is grateful to Dr. C.R. Ferrari
and the crew of Daphne II (Emilia-Romagna Region) for sample collection and to Dr. L. Onorato for assistance in laboratory work. This research was in part supported by the Italian
Ministry for University and Research within PRISMA 1
Project.
References
Ahmad SR, Reynolds DM (1995) Synchronous fluorescence spectroscopy of wastewater and some potential constituents.
Water Res 29: 1599-1602
Cabaniss SE, Shuman MS (1987) Synchronous fluorescence spectra of natural waters: tracing sources of dissolved organic
matter. Mar Chern 21: 37-50
Chen FR, Bada }L (1992) The fluorescence of dissolved organic
matter in seawater. Mar Chern 37: 191-221
Coble PG (1996) Characterization of marine and terrestrial DOM
in seawater using excitation-emission matrix spectroscopy.
Mar Chem 51: 325-346
De Souza Sierra MM, Donard OXP, Lamotte M, Belin C, Ewald M
(1994) Fluorescence spectroscopy of coastal and marine
waters. Mar Chem 47: 127-144
EPA (1974) Marine algal assay procedure: bottle test (eutrophica-
121
Fig. 8. Trend over time of the EOM
180
0
produced by the natural phytoplankton (Station 2 sample): linear increase
Po160
oCB (top equation, n=7,P
E
(bottom equation, n=6, P=O.026). The
c:
0
fluorescence intensity of the Po sam~ 120
pIe (dotted line) ill plotted in figure
a:l
for purpose of comparison
::j 100
u.:
80
...
60
0
nent, which was naturally present in the unfiltered samples.
Figure 8 (Station 2. as representative sample)
clearly shows how the trend over time of both the
fluorescence parameters (B and AlB) closely follows the model (Fig. 3) defIned on monospecifIc
diatom cultures. At the beginning of the incubation time, the UV lvisible ratio AlB increases, giving experimental evidence of what can happen in
surface marine waters, due to a recent phytoplankton production. After a few days, the AlB
ratio decreases as the B component accumulates.
It is also to be noted that the humic-like B component, never considered before as a possible
phytoplankton contribution to the marine DOM,
can reach fluorescence intensities as high as the
humic riverine contribution. While such massive
quantities are unlikely to accumulate in surface
waters, this EOM component can still represent
an important contribution in shallow waters,
pycnocline layers or reduced water exchange
conditions.
Conclusions
These results provide experimental evidence of
the ability of the two parameters: Ex max in the
visible region and UV lvisible Ex max ratio to
monitor the nature and distribution of different
components mixed in Adriatic seawater DOM. In
particular:
1. The band T is a fluorescent tracer of the
humic terrestrial contribution, effective to
defme the dilution trend of the riverine
DOM;
,
y = 2,667x + 69.696
7
R2 = 0.996
.' ,.' 6
5
E
, ,.'
c:
0
..,.
4 ~
(Q
r-3 N
0
--. . '
III
y = 6.94e- o . oax
2 <
R2 = 0.75
1
0
10
20
30
days 40
•
B - - - Po input 0 AlBJ
2. The AIT ratio describes changes in the relative contribution of the terrestrial and newly
produced components, respectively mixed in
seawater DOM;
3. The trend model of the B and AlB parameters, as determined on algal cultures, is closely followed by the natural phytoplankton
EOM. demonstrating for the fIrst time the
accumulation potential of the humic-like B
component, as a phytoplankton contribution
to the marine DOM.
The results from natural samples support the
effectiveness of the spectrofluorimetric approach
to trace and monitor the North Adriatic DOM.
Acknowledgements. The author is grateful to Dr. C.R. Ferrari
and the crew of Daphne II (Emilia-Romagna Region) for sample collection and to Dr. L. Onorato for assistance in laboratory work. This research was in part supported by the Italian
Ministry for University and Research within PRISMA 1
Project.
References
Ahmad SR, Reynolds DM (1995) Synchronous fluorescence spectroscopy of wastewater and some potential constituents.
Water Res 29: 1599-1602
Cabaniss SE, Shuman MS (1987) Synchronous fluorescence spectra of natural waters: tracing sources of dissolved organic
matter. Mar Chern 21: 37-50
Chen FR, Bada }L (1992) The fluorescence of dissolved organic
matter in seawater. Mar Chern 37: 191-221
Coble PG (1996) Characterization of marine and terrestrial DOM
in seawater using excitation-emission matrix spectroscopy.
Mar Chem 51: 325-346
De Souza Sierra MM, Donard OXP, Lamotte M, Belin C, Ewald M
(1994) Fluorescence spectroscopy of coastal and marine
waters. Mar Chem 47: 127-144
EPA (1974) Marine algal assay procedure: bottle test (eutrophica-