

0.0
1994
1992
1990
~ 1968
~ 1986
1964
1962
19110
1976
0.0
0.0
1994
1992
1990
12 1968
~ 1986
1964
1982
1980
1976
o
0.4
0.2
2
Cadmium
jJg g>' (Rhizomes)
0.8
1.2
1.2
liS g" (Sheaths)
Iron
mg gO' (Rhizomes)
0.4
0.6
O.S
e
8
mg g>l (Sheaths)
1.6
2.0
-
Rhizomes
>.<>. Sheaths
1.6
1.0
- - Rhizomes
•• t>. Sheaths
10
2.0
1.2
12
Trace Metals (Cd, Cn. Fe, Pb) in Posidonia oceanica Seagrass
97
1994
1992
1990
~ 1988
~ 1988
1964
1962
1980
1978
2
2
4
Copper
l1li g>' (Rhizomes)
6
s
jJg g" (Sheaths)
Lead
I'll g>l (Rhizomes)
10
12
14
10
- - Rhizomes
"0"
Shea!hs
12
0.0
O.S
1.0
1.5
2.0
2.5
3.0
3.5
4.0
1994
1992
1990
I!l 1988
~ 1988
1984
1982
1900
1978
o
5
--- Rhizomes
.. 0·· Sheaths
10
15
20
25
30
35
40
jJ9 g" (Sheaths)
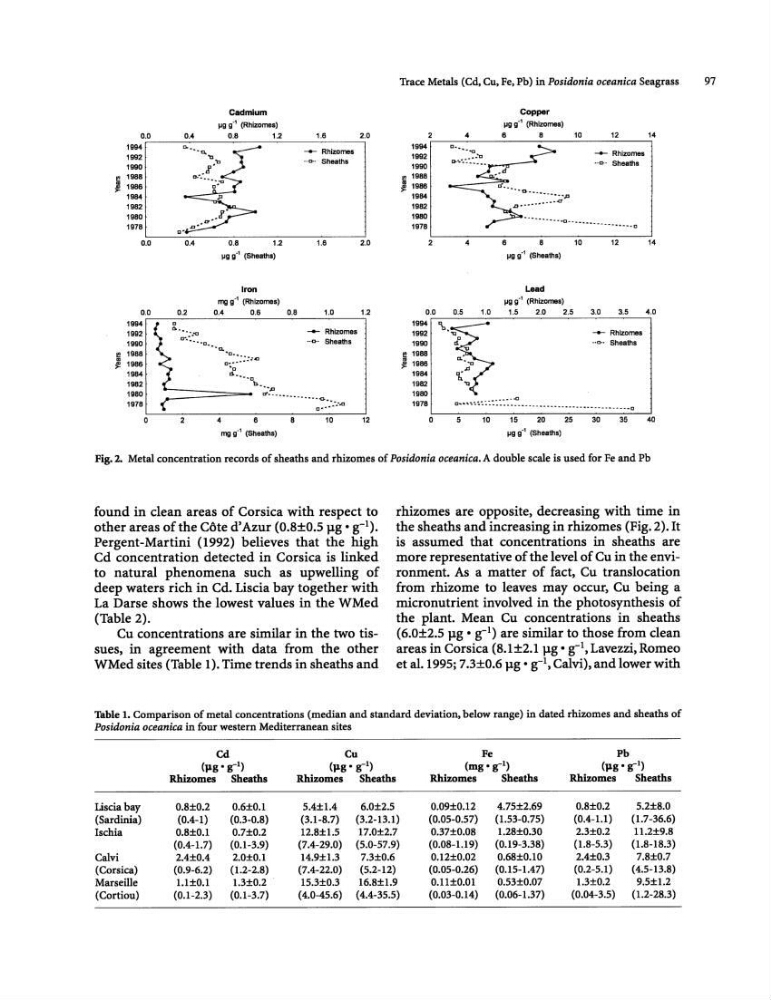
Fig.2. Metal concentration records of sheaths and rhizomes of Posidonia oceanica. A double scale is used for Fe and Ph
found in clean areas of Corsica with respect to
other areas of the Cote d'Azur (O.8±O.5 p.g' g-l).
Pergent-Martini (1992) believes that the high
Cd concentration detected in Corsica is linked
to natural phenomena such as upwelling of
deep waters rich in Cd. Lisda bay together with
La Darse shows the lowest values in the WMed
(Table 2).
Cu concentrations are similar in the two tissues, in agreement with data from the other
WMed sites (Table I). Time trends in sheaths and
rhizomes are opposite, decreasing with time in
the sheaths and increasing in rhizomes (Fig. 2). It
is assumed that concentrations in sheaths are
more representative of the level of Cu in the environment. As a matter of fact, Cu translocation
from rhizome to leaves may occur, Cu being a
micronutrient involved in the photosynthesis of
the plant. Mean Cu concentrations in sheaths
(6.0±2.5 p.g. g-l) are similar to those from clean
areas in Corsica (8.1±2.1 p.g. g-l, Lavezzi, Romeo
et al. 1995; 7.3±O.6 p.g • g-l, Calvi), and lower with
Table 1. Comparison of metal concentrations (median and standard deviation, below range) in dated rhizomes and sheaths of
Posidonia oceanica in four western Mediterranean sites
Cd
Cn
Fe
Pb
(pg. g-l)
(pg. g-l)
(mg· g-!)
(pg. g-I)
Rhizomes Sheaths
Rhizomes Sheaths
R.hizomes
Sheaths
Rhizomes
Sheaths
Lisda bay
0.8±O.2
O.6±O.1
5.4±1.4
6.0±2.5
0.09±O.12
4.75±2.69
0.S±0.2
5.2±S.0
(Sardinia)
(0.4-1)
(0.3-0.S)
(3.1-8.7)
(3.2-13.1)
(0.05-0.57)
(1.53-0.75)
(0.4-1.1)
(1.7-36.6)
Ischia
0.8±O.1
0.7±O.2
12.8±1.5
17.0±2.7
0.37±0.08
1.28±0.30
2.3±0.2
11.2±9.8
(0.4-1.7)
(0.1-3.9)
(7.4-29.0) (5.0-57.9)
(0.08-1.19)
(0.19-3.38)
(1.8-5.3)
(1.8-18.3)
Calvi
2.4±O.4
2.0±0.1
14.9±1.3
7.3±0.6
0.12±0.02
0.68±0.1O
2.4±0.3
7.8±0.7
(Corsica)
(0.9-6.2)
(1.2-2.8)
(7.4-22.0)
(5.2-12)
(0.05-0.26)
(0.15-1.47)
(0.2-5.1)
(4.5-13.8)
Marseille
1.l±0.1
1.3±0.2
15.3±0.3
16.8±1.9
0.11±0.01
0.53±0.07
1.3±0.2
9.5±1.2
(Cortiou)
(0.1-2.3)
(0.1-3.7)
(4.0-45.6) (4.4-35.5)
(0.03-0.14)
(0.06-1.37)
(0.04-3.5)
(1.2-28.3)
1994
1992
1990
~ 1968
~ 1986
1964
1962
19110
1976
0.0
0.0
1994
1992
1990
12 1968
~ 1986
1964
1982
1980
1976
o
0.4
0.2
2
Cadmium
jJg g>' (Rhizomes)
0.8
1.2
1.2
liS g" (Sheaths)
Iron
mg gO' (Rhizomes)
0.4
0.6
O.S
e
8
mg g>l (Sheaths)
1.6
2.0
-
Rhizomes
>.<>. Sheaths
1.6
1.0
- - Rhizomes
•• t>. Sheaths
10
2.0
1.2
12
Trace Metals (Cd, Cn. Fe, Pb) in Posidonia oceanica Seagrass
97
1994
1992
1990
~ 1988
~ 1988
1964
1962
1980
1978
2
2
4
Copper
l1li g>' (Rhizomes)
6
s
jJg g" (Sheaths)
Lead
I'll g>l (Rhizomes)
10
12
14
10
- - Rhizomes
"0"
Shea!hs
12
0.0
O.S
1.0
1.5
2.0
2.5
3.0
3.5
4.0
1994
1992
1990
I!l 1988
~ 1988
1984
1982
1900
1978
o
5
--- Rhizomes
.. 0·· Sheaths
10
15
20
25
30
35
40
jJ9 g" (Sheaths)
Fig.2. Metal concentration records of sheaths and rhizomes of Posidonia oceanica. A double scale is used for Fe and Ph
found in clean areas of Corsica with respect to
other areas of the Cote d'Azur (O.8±O.5 p.g' g-l).
Pergent-Martini (1992) believes that the high
Cd concentration detected in Corsica is linked
to natural phenomena such as upwelling of
deep waters rich in Cd. Lisda bay together with
La Darse shows the lowest values in the WMed
(Table 2).
Cu concentrations are similar in the two tissues, in agreement with data from the other
WMed sites (Table I). Time trends in sheaths and
rhizomes are opposite, decreasing with time in
the sheaths and increasing in rhizomes (Fig. 2). It
is assumed that concentrations in sheaths are
more representative of the level of Cu in the environment. As a matter of fact, Cu translocation
from rhizome to leaves may occur, Cu being a
micronutrient involved in the photosynthesis of
the plant. Mean Cu concentrations in sheaths
(6.0±2.5 p.g. g-l) are similar to those from clean
areas in Corsica (8.1±2.1 p.g. g-l, Lavezzi, Romeo
et al. 1995; 7.3±O.6 p.g • g-l, Calvi), and lower with
Table 1. Comparison of metal concentrations (median and standard deviation, below range) in dated rhizomes and sheaths of
Posidonia oceanica in four western Mediterranean sites
Cd
Cn
Fe
Pb
(pg. g-l)
(pg. g-l)
(mg· g-!)
(pg. g-I)
Rhizomes Sheaths
Rhizomes Sheaths
R.hizomes
Sheaths
Rhizomes
Sheaths
Lisda bay
0.8±O.2
O.6±O.1
5.4±1.4
6.0±2.5
0.09±O.12
4.75±2.69
0.S±0.2
5.2±S.0
(Sardinia)
(0.4-1)
(0.3-0.S)
(3.1-8.7)
(3.2-13.1)
(0.05-0.57)
(1.53-0.75)
(0.4-1.1)
(1.7-36.6)
Ischia
0.8±O.1
0.7±O.2
12.8±1.5
17.0±2.7
0.37±0.08
1.28±0.30
2.3±0.2
11.2±9.8
(0.4-1.7)
(0.1-3.9)
(7.4-29.0) (5.0-57.9)
(0.08-1.19)
(0.19-3.38)
(1.8-5.3)
(1.8-18.3)
Calvi
2.4±O.4
2.0±0.1
14.9±1.3
7.3±0.6
0.12±0.02
0.68±0.1O
2.4±0.3
7.8±0.7
(Corsica)
(0.9-6.2)
(1.2-2.8)
(7.4-22.0)
(5.2-12)
(0.05-0.26)
(0.15-1.47)
(0.2-5.1)
(4.5-13.8)
Marseille
1.l±0.1
1.3±0.2
15.3±0.3
16.8±1.9
0.11±0.01
0.53±0.07
1.3±0.2
9.5±1.2
(Cortiou)
(0.1-2.3)
(0.1-3.7)
(4.0-45.6) (4.4-35.5)
(0.03-0.14)
(0.06-1.37)
(0.04-3.5)
(1.2-28.3)