

4.3 Statistical Methods
63
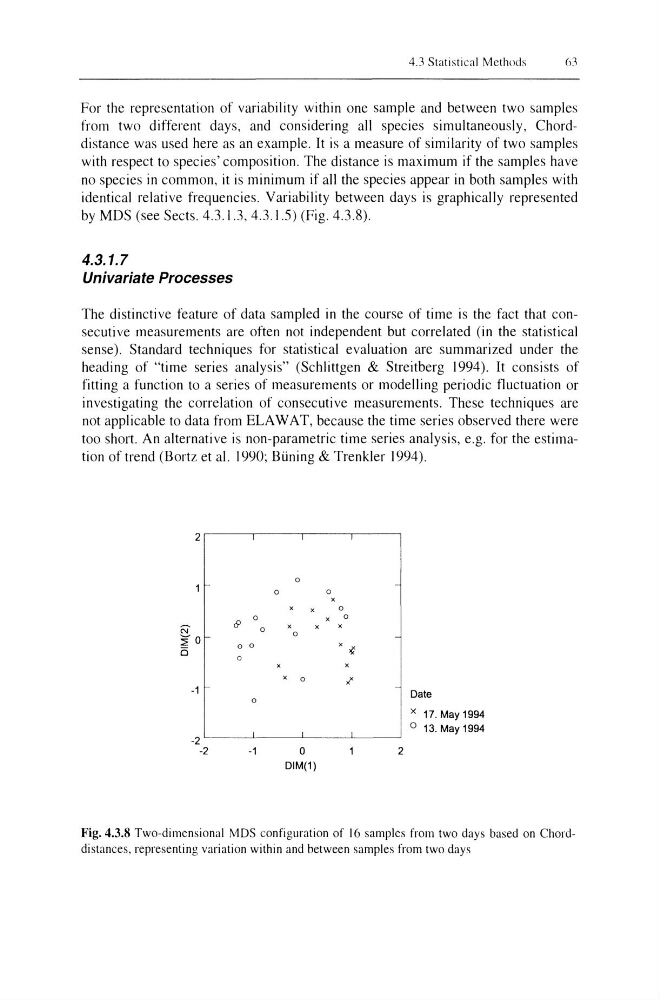
For the representation of variability within one sample and between two samples
from two different days, and considering all species simultaneously, Chorddistance was used here as an example. It is a measure of similarity of two samples
with respect to species' composition. The distance is maximum if the samples have
no species in common, it is minimum if all the species appear in both samples with
identical relative frequencies. Variability between days is graphically represented
by MDS (see Sects. 4.3.1.3, 4.3.1.5) (Fig. 4.3.8).
4.3.1.7
Univariate Processes
The distinctive feature of data sampled in the course of time is the fact that consecutive measurements are often not independent but correlated (in the statistical
sense). Standard techniques for statistical evaluation are summarized under the
heading of "time series analysis" (Schlittgen & Streitberg 1994). It consists of
fitting a function to a series of measurements or modelling periodic fluctuation or
investigating the correlation of consecutive measurements. These techniques are
not applicable to data from ELA W A T, because the time series observed there were
too short. An alternative is non-parametric time series analysis, e.g. for the estimation of trend (Bortz et al. 1990; Biining & Trenkler 1994).
2
0
0
0
0
0
0
N
c9
0
x
~o
0
15
a 0
x >I:
0
x
0
XX
-1
Date
0
x 17. May 1994
o 13. May 1994
-2
-2
-1
0
2
DIM(1)
Fig. 4.3.8 Two-dimensional MDS configuration of 16 samples from two days based on Chorddistances, representing variation within and between samples from two days
63
For the representation of variability within one sample and between two samples
from two different days, and considering all species simultaneously, Chorddistance was used here as an example. It is a measure of similarity of two samples
with respect to species' composition. The distance is maximum if the samples have
no species in common, it is minimum if all the species appear in both samples with
identical relative frequencies. Variability between days is graphically represented
by MDS (see Sects. 4.3.1.3, 4.3.1.5) (Fig. 4.3.8).
4.3.1.7
Univariate Processes
The distinctive feature of data sampled in the course of time is the fact that consecutive measurements are often not independent but correlated (in the statistical
sense). Standard techniques for statistical evaluation are summarized under the
heading of "time series analysis" (Schlittgen & Streitberg 1994). It consists of
fitting a function to a series of measurements or modelling periodic fluctuation or
investigating the correlation of consecutive measurements. These techniques are
not applicable to data from ELA W A T, because the time series observed there were
too short. An alternative is non-parametric time series analysis, e.g. for the estimation of trend (Bortz et al. 1990; Biining & Trenkler 1994).
2
0
0
0
0
0
0
N
c9
0
x
~o
0
15
a 0
x >I:
0
x
0
XX
-1
Date
0
x 17. May 1994
o 13. May 1994
-2
-2
-1
0
2
DIM(1)
Fig. 4.3.8 Two-dimensional MDS configuration of 16 samples from two days based on Chorddistances, representing variation within and between samples from two days