

64
4 Statistical Models and Techniques
4.3.1.8
Case Study: Composition of Suspended Matter
Data provided by A. Hild.
Hypothesis: Variation in Mn-content of suspended matter in winter is caused by
different percentages of fine material (and thus by AIPJ-content), whereas this
link does not exist in summer. Hence, the quotient of Mn and AIPJ differs over
the year.
Question: The hypothesis can be specified by two different questions. If it is
important to examine the way the values develop during the year, then the question
will be: is there an increase in the Mn to AlpJ-relation from the beginning of the
year until midsummer and a decrease from midsummer to the end of the year (reverse U-shape)'7 If only the difference between summer and winter is important,
then the question will be: are, on average, the summer values higher than the winter val ues ')
Sampling: In the months of February and March, May to September, November
and December samples were taken on two consecutive days at several time points.
Statistical technique: As sampling was done within short time intervals, it has to
be assumed that measurements of one or of two consecutive sampling dates are not
independent. For each month the median was calculated from the sub-samples. It is
assumed that the monthly median values are correlated. Because a statistical hypothesis has to be generated before sampling and not - as was the case here - after
investigation of the data, the test result in the current case study is merely a hint to
a phenomenon, not its statistical proof.
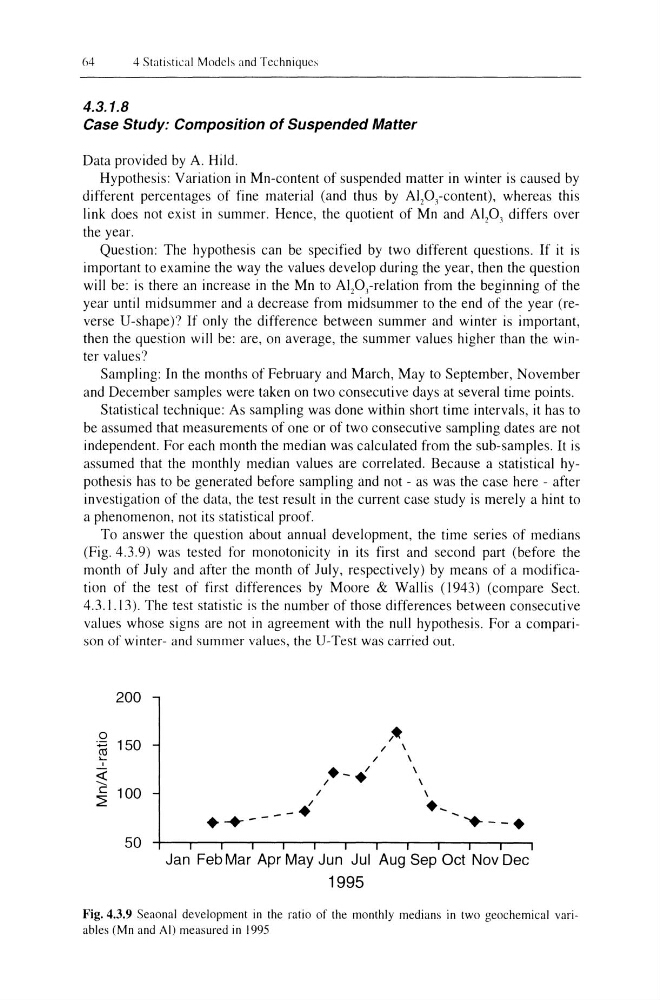
To answer the question about annual development, the time series of medians
(Fig. 4.3.9) was tested for monotonicity in its first and second part (before the
month of July and after the month of July, respectively) by means of a modification of the test of first differences by Moore & Wallis (1943) (compare Sect.
4.3.1.13). The test statistic is the number of those differences between consecutive
values whose signs are not in agreement with the null hypothesis. For a comparison of winter- and summer values, the U-Test was carried out.
200
0
~
150
,
~ c 100
~
50
I
I
+.----+
\
\
\
+- '+---+
Jan Feb Mar Apr May Jun Jul Aug Sep Oct Nov Dec
1995
Fig. 4.3.9 Seaonal development in the ratio of the monthly medians in two geochemical variables (Mn and AI) measured in 1995
4 Statistical Models and Techniques
4.3.1.8
Case Study: Composition of Suspended Matter
Data provided by A. Hild.
Hypothesis: Variation in Mn-content of suspended matter in winter is caused by
different percentages of fine material (and thus by AIPJ-content), whereas this
link does not exist in summer. Hence, the quotient of Mn and AIPJ differs over
the year.
Question: The hypothesis can be specified by two different questions. If it is
important to examine the way the values develop during the year, then the question
will be: is there an increase in the Mn to AlpJ-relation from the beginning of the
year until midsummer and a decrease from midsummer to the end of the year (reverse U-shape)'7 If only the difference between summer and winter is important,
then the question will be: are, on average, the summer values higher than the winter val ues ')
Sampling: In the months of February and March, May to September, November
and December samples were taken on two consecutive days at several time points.
Statistical technique: As sampling was done within short time intervals, it has to
be assumed that measurements of one or of two consecutive sampling dates are not
independent. For each month the median was calculated from the sub-samples. It is
assumed that the monthly median values are correlated. Because a statistical hypothesis has to be generated before sampling and not - as was the case here - after
investigation of the data, the test result in the current case study is merely a hint to
a phenomenon, not its statistical proof.
To answer the question about annual development, the time series of medians
(Fig. 4.3.9) was tested for monotonicity in its first and second part (before the
month of July and after the month of July, respectively) by means of a modification of the test of first differences by Moore & Wallis (1943) (compare Sect.
4.3.1.13). The test statistic is the number of those differences between consecutive
values whose signs are not in agreement with the null hypothesis. For a comparison of winter- and summer values, the U-Test was carried out.
200
0
~
150
,
~ c 100
~
50
I
I
+.----+
\
\
\
+- '+---+
Jan Feb Mar Apr May Jun Jul Aug Sep Oct Nov Dec
1995
Fig. 4.3.9 Seaonal development in the ratio of the monthly medians in two geochemical variables (Mn and AI) measured in 1995