

62
4 Statistical Models and Techniques
.l!!
40
~ Q.
co
l>
30
~
~
~ 20
u
'+f I
a
j
1
Q)
u
I 1
c
I
I
"0
I
t:
I
:::J
.D
I
(II
0
1:
04 05 06 07 08 09 10 11 12 13 14 15 16 17 18 19
May 1994
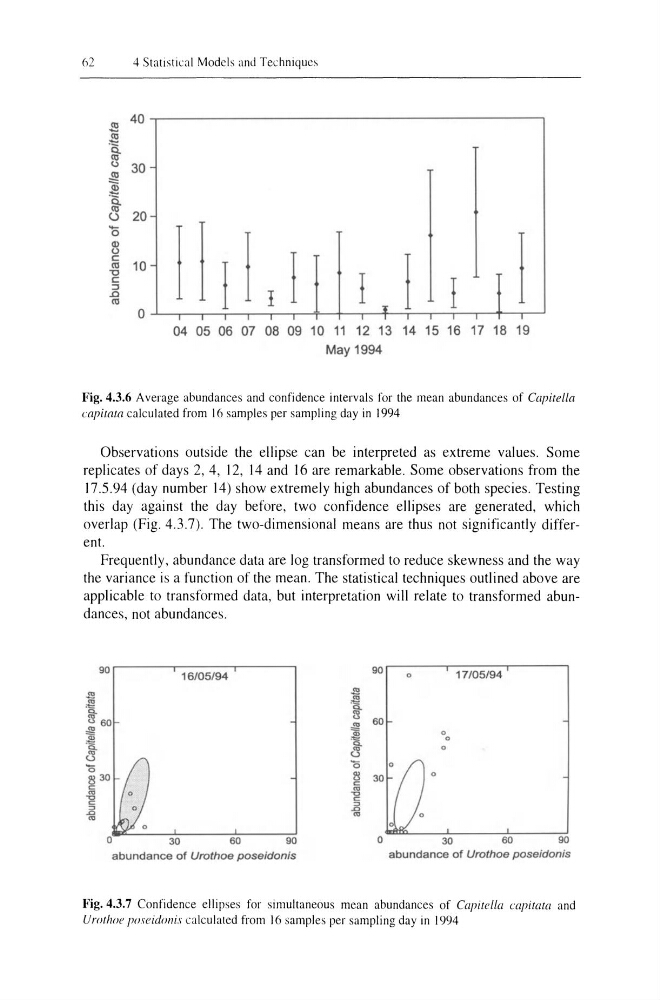
Fig. 4.3.6 Average abundances and confidence intervals for the mean abundances of Capitella
C(/pitata calculated from 16 samples per sampling day in 1994
Observations outside the ellipse can be interpreted as extreme values. Some
replicates of days 2, 4, 12, 14 and 16 are remarkable. Some observations from the
17.5.94 (day number 14) show extremely high abundances of both species. Testing
this day against the day before, two confidence ellipses are generated, which
overlap (Fig. 4.3.7). The two-dimensional means are thus not significantly different.
Frequently, abundance data are log transformed to reduce skewness and the way
the variance is a function of the mean. The statistical techniques outlined above are
applicable to transformed data, but interpretation will relate to transformed abundances, not abundances.
90
16/05/94
90
0
17105/94
.>!!
.>!!
'"
.,
1
"" Q.
~ 60
60
i
,§
0
:§1
0
~
0
u
'0
'0
~ 30
~
0
c:
c:
'"
'"
~
-0
c:
c:
il
::>
-'"
'"
'"
30
60
90
0
30
60
90
abundance of Urothoe poseldon/s
abundance of Urothoe poseidonis
Fig. 4.3.7 Confidence ellipses for simultaneous mean abundances of Capitella capitata and
Urolhoc jio.l'eidoni.l' calculated from 16 samples per sampling day in 1994
4 Statistical Models and Techniques
.l!!
40
~ Q.
co
l>
30
~
~
~ 20
u
'+f I
a
j
1
Q)
u
I 1
c
I
I
"0
I
t:
I
:::J
.D
I
(II
0
1:
04 05 06 07 08 09 10 11 12 13 14 15 16 17 18 19
May 1994
Fig. 4.3.6 Average abundances and confidence intervals for the mean abundances of Capitella
C(/pitata calculated from 16 samples per sampling day in 1994
Observations outside the ellipse can be interpreted as extreme values. Some
replicates of days 2, 4, 12, 14 and 16 are remarkable. Some observations from the
17.5.94 (day number 14) show extremely high abundances of both species. Testing
this day against the day before, two confidence ellipses are generated, which
overlap (Fig. 4.3.7). The two-dimensional means are thus not significantly different.
Frequently, abundance data are log transformed to reduce skewness and the way
the variance is a function of the mean. The statistical techniques outlined above are
applicable to transformed data, but interpretation will relate to transformed abundances, not abundances.
90
16/05/94
90
0
17105/94
.>!!
.>!!
'"
.,
1
"" Q.
~ 60
60
i
,§
0
:§1
0
~
0
u
'0
'0
~ 30
~
0
c:
c:
'"
'"
~
-0
c:
c:
il
::>
-'"
'"
'"
30
60
90
0
30
60
90
abundance of Urothoe poseldon/s
abundance of Urothoe poseidonis
Fig. 4.3.7 Confidence ellipses for simultaneous mean abundances of Capitella capitata and
Urolhoc jio.l'eidoni.l' calculated from 16 samples per sampling day in 1994