

4.3 StatistIcal Methods
61
Graphically, variability can be described as "spread of the cloud". Two such
"clouds" will be considered different, if their overlap is small compared to their
size. This is the main idea underlying the multivariate tests described in
Sect. 4.3.3.
If two consecutive sampling times were relatively close to each other, it will be
necessary to check the data for temporal correlation (see the sections of this chapter on processes: 4.3.1.7, 4.3.1.9, 4.3.1.10, 4.3.1.12).
4.3.1.6
Case Study: Variability in Benthos Data
Data provided by J. Steuwer.
Question: How strongly do abundances of macrofauna organisms vary on consecutive days in spring? Species with highest abundance were selected: Capitella
capitata and Urothoe poseidonis.
Sampling: From 4.5.94-19.5.94 sixteen replicate benthos samples were taken
daily.
Statistical technique: Notched box plot, confidence plot, variance and confidence ellipses, variability described by chord distance.
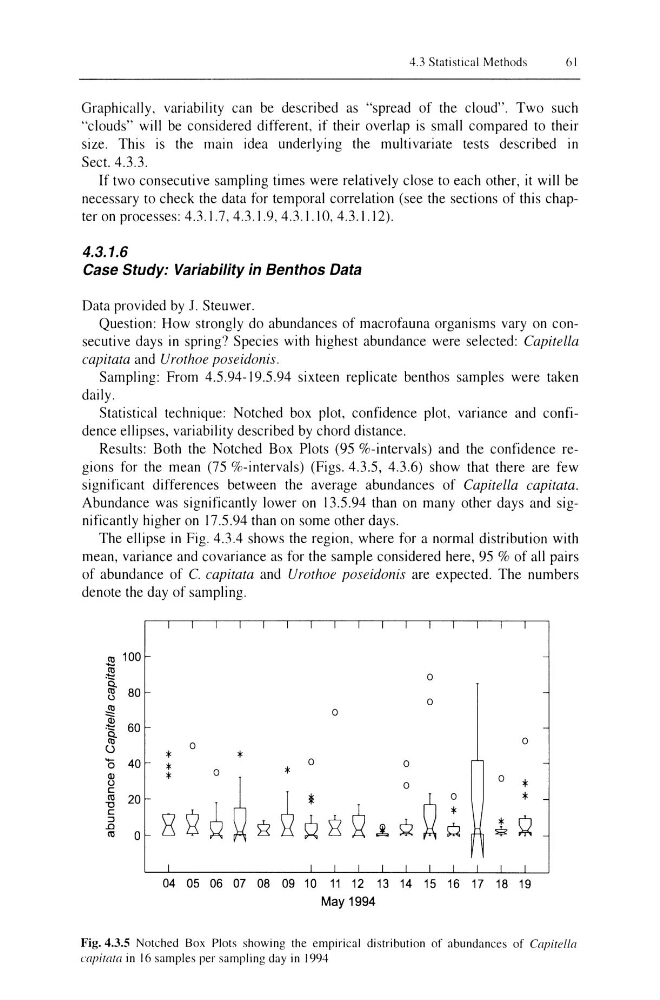
Results: Both the Notched Box Plots (95 %-intervals) and the confidence regions for the mean (75 %-intervals) (Figs. 4.3.5, 4.3.6) show that there are few
significant differences between the average abundances of Capitella capitata.
Abundance was significantly lower on 13.5.94 than on many other days and significantl y higher on 17.5.94 than on some other days.
The ellipse in Fig. 4.3.4 shows the region, where for a normal distribution with
mean, variance and covariance as for the sample considered here, 95 % of all pairs
of abundance of C. capitata and Urothoe poseidonis are expected. The numbers
denote the day of sampling .
.l!l 100
:§
fij- 80
u
<0
:::::
~ 60
Q.
<0
0
a 40
Q)
u
c
til
20
-0
c
::J
.0
til
0
0
0
0
0
0
*
*
*
0
0
*
0
*
0
28~~>i6;
0
*
~
0
*
£Q.tQ *
Q
04 05 06 07 08 09 10 11 12 13 14 15 16 17 18 19
May 1994
Fig. 4.3.5 Notched Box Plots showing the empirical distribution of abundances of Capitella
capirala in 16 samples per sampling day in 1994
61
Graphically, variability can be described as "spread of the cloud". Two such
"clouds" will be considered different, if their overlap is small compared to their
size. This is the main idea underlying the multivariate tests described in
Sect. 4.3.3.
If two consecutive sampling times were relatively close to each other, it will be
necessary to check the data for temporal correlation (see the sections of this chapter on processes: 4.3.1.7, 4.3.1.9, 4.3.1.10, 4.3.1.12).
4.3.1.6
Case Study: Variability in Benthos Data
Data provided by J. Steuwer.
Question: How strongly do abundances of macrofauna organisms vary on consecutive days in spring? Species with highest abundance were selected: Capitella
capitata and Urothoe poseidonis.
Sampling: From 4.5.94-19.5.94 sixteen replicate benthos samples were taken
daily.
Statistical technique: Notched box plot, confidence plot, variance and confidence ellipses, variability described by chord distance.
Results: Both the Notched Box Plots (95 %-intervals) and the confidence regions for the mean (75 %-intervals) (Figs. 4.3.5, 4.3.6) show that there are few
significant differences between the average abundances of Capitella capitata.
Abundance was significantly lower on 13.5.94 than on many other days and significantl y higher on 17.5.94 than on some other days.
The ellipse in Fig. 4.3.4 shows the region, where for a normal distribution with
mean, variance and covariance as for the sample considered here, 95 % of all pairs
of abundance of C. capitata and Urothoe poseidonis are expected. The numbers
denote the day of sampling .
.l!l 100
:§
fij- 80
u
<0
:::::
~ 60
Q.
<0
0
a 40
Q)
u
c
til
20
-0
c
::J
.0
til
0
0
0
0
0
0
*
*
*
0
0
*
0
*
0
28~~>i6;
0
*
~
0
*
£Q.tQ *
Q
04 05 06 07 08 09 10 11 12 13 14 15 16 17 18 19
May 1994
Fig. 4.3.5 Notched Box Plots showing the empirical distribution of abundances of Capitella
capirala in 16 samples per sampling day in 1994