

5.4 Modelling the Spatial ami Temporal Distribution of L{ll/ice conchi/ego
14<)
ship between density-dependent recruitment probability, Pd, and local density, N
(Fig. 5.4.1). Scale is a scaling parameter modifying the slope of the curves in
Fig.5.4.1.
Ps is a probability, i.e. a number in the interval [0, 1]. The formula for calculating Pd means that for a high overall velocity of the near-bottom flow, even a
relatively low local tube density leads to high recruitment, whereas for a low velocity of the near-bottom flow even high local tube densities will only allow for
low recruitment (cf. Carey 1983; Eckman 1983; Butman 1986; Harvey et al. 1995;
Friedrichs 1996). The idea behind this assumption is that for a given flow velocity
a critical tube density is necessary to generate a flow skimming over the tube patch
leaving a layer within the patch with reduced net tlow velocities. Within this layer,
larval settlement may be facilitated or larvae may actively select for such tlow
conditions. It is assumed that the critical tube density decreases with increasing
overall tlow velocity.
Local density within a grid cell is limited by a local carrying capacity (for the
results presented here, ten tubes). If after calculating recruitment more than ten
tubes stand in a grid cell, the number of tubes is reduced to ten. After calculating
1.0
IJ)
10
Q)
.n
.2
Dc
>'Q)
'0
Q;
5
.n
E
'"
0.5
=E
:.0 . ...:
<\I :J
.n~
o u
Il:~
z 0
0.0
>.
Q) . ...:
10
.n IJ)
5
:J c
f- Q)
l:l
0
... 1{"\ · \"',\,&·fo~ • .{
•
I •
••
•
• I . "'~ """,,0 .\'.
•
• •• - • ~ r
".
o
50
100
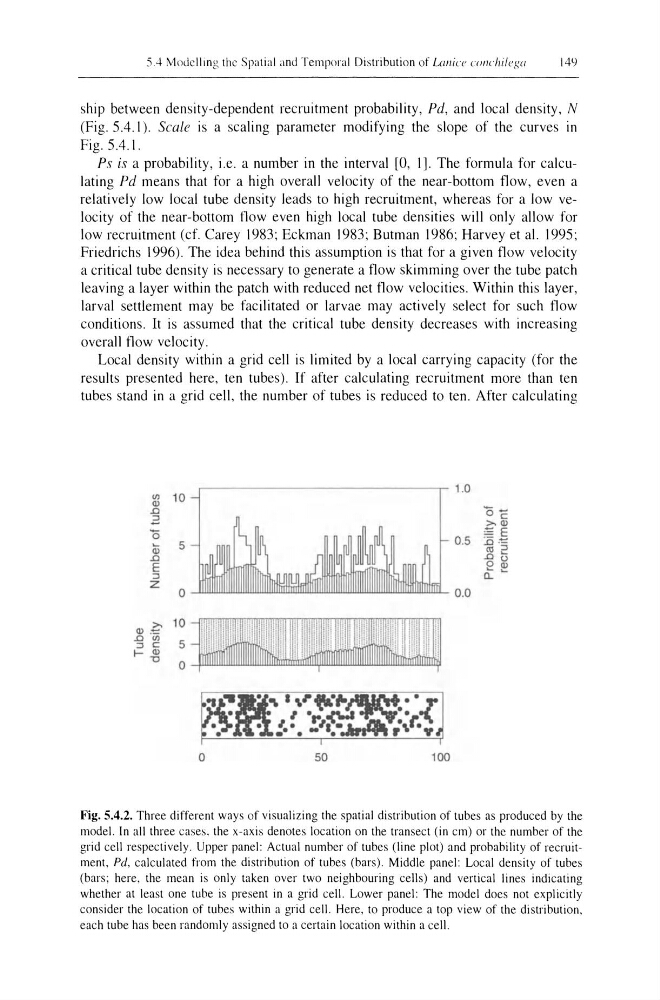
Fig. 5.4.2. Three different ways of visualizing the spatial distribution of tubes as produced by the
model. In all three cases, the x-axis denotes location on the transect (in cm) or the number of the
grid cell respectively. Upper panel: Actual number of tubes (line plot) and probability of recruitment, Pd, calculated from the distribution of tubes (bars). Middle panel: Local density of tubes
(bars; here, the mean is only taken over two neighbouring cells) and vertical lines indicating
whether at least one tube is present in a grid cell. Lower panel: The model does not explicitly
consider the location of tubes within a grid cell. Here, to produce a top view of the distribution,
each tube has been randomly assigned to a certain location within a cell.
14<)
ship between density-dependent recruitment probability, Pd, and local density, N
(Fig. 5.4.1). Scale is a scaling parameter modifying the slope of the curves in
Fig.5.4.1.
Ps is a probability, i.e. a number in the interval [0, 1]. The formula for calculating Pd means that for a high overall velocity of the near-bottom flow, even a
relatively low local tube density leads to high recruitment, whereas for a low velocity of the near-bottom flow even high local tube densities will only allow for
low recruitment (cf. Carey 1983; Eckman 1983; Butman 1986; Harvey et al. 1995;
Friedrichs 1996). The idea behind this assumption is that for a given flow velocity
a critical tube density is necessary to generate a flow skimming over the tube patch
leaving a layer within the patch with reduced net tlow velocities. Within this layer,
larval settlement may be facilitated or larvae may actively select for such tlow
conditions. It is assumed that the critical tube density decreases with increasing
overall tlow velocity.
Local density within a grid cell is limited by a local carrying capacity (for the
results presented here, ten tubes). If after calculating recruitment more than ten
tubes stand in a grid cell, the number of tubes is reduced to ten. After calculating
1.0
IJ)
10
Q)
.n
.2
Dc
>'Q)
'0
Q;
5
.n
E
'"
0.5
=E
:.0 . ...:
<\I :J
.n~
o u
Il:~
z 0
0.0
>.
Q) . ...:
10
.n IJ)
5
:J c
f- Q)
l:l
0
... 1{"\ · \"',\,&·fo~ • .{
•
I •
••
•
• I . "'~ """,,0 .\'.
•
• •• - • ~ r
".
o
50
100
Fig. 5.4.2. Three different ways of visualizing the spatial distribution of tubes as produced by the
model. In all three cases, the x-axis denotes location on the transect (in cm) or the number of the
grid cell respectively. Upper panel: Actual number of tubes (line plot) and probability of recruitment, Pd, calculated from the distribution of tubes (bars). Middle panel: Local density of tubes
(bars; here, the mean is only taken over two neighbouring cells) and vertical lines indicating
whether at least one tube is present in a grid cell. Lower panel: The model does not explicitly
consider the location of tubes within a grid cell. Here, to produce a top view of the distribution,
each tube has been randomly assigned to a certain location within a cell.