

14R
5 Spatial and Temporal Distribution Patterns
larvae of L. c()l1chilega are attached to the tubes of adults and build their first tube.
Sooner or later the juvenile L. cOflchilega then leaves the adult's tube and plants its
own tube into the sediment. How far the juveniles move from their initial site of
settlement is unknown; in the model, we assume a maximum distance of 5 cm.
Thus, to calculate recruitment in a certain cell, a neighbourhood of 5 cm on either
side has to be taken into account.
Now, the calculation of Pd depends on assumptions of how local tube density
determines local recruitment. The most simple approach would be to assume a
linear relationship between Pd and N, which has been tested in the model (Heuers
et a!. 1998). With this assumption, it was not possible to reproduce two empirical
findings simultaneously: the emergence of patches with low or high density of
L. c()nchilega and the short time span which is needed to establish these densities.
The model thus suggests that simply the amount of hard substrate provided by the
adult's tubes is not sufficient to explain the spatial and temporal distribution of
L. conchilega observed in the field.
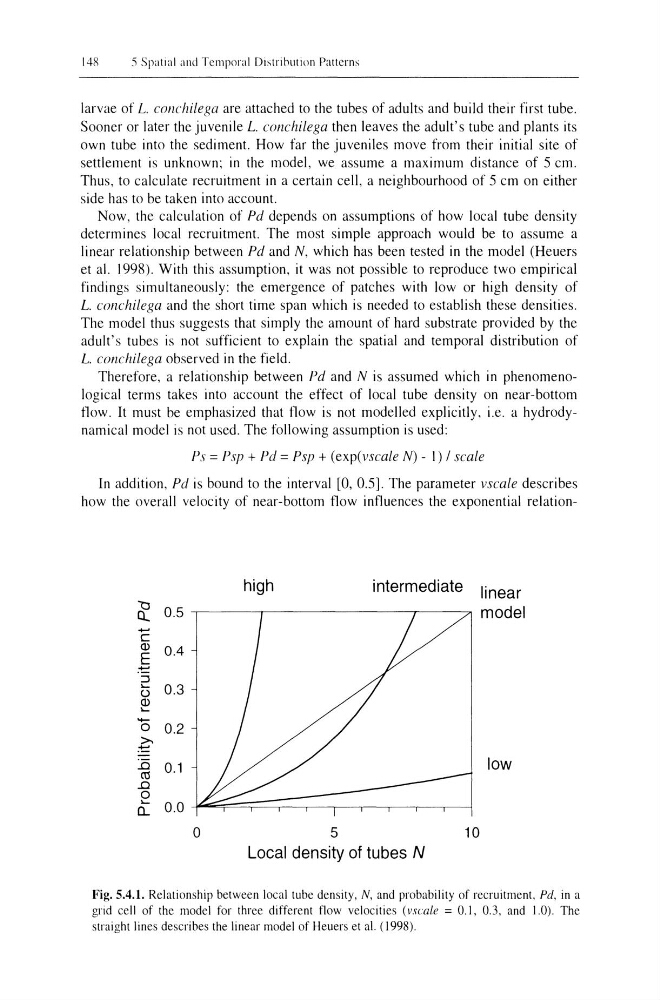
Therefore, a relationship between Pd and N is assumed which in phenomenological terms takes into account the effect of local tube density on near-bottom
flow. It must be emphasized that flow is not modelled explicitly, i.e. a hydrodynamical model is not used. The following assumption is used:
Ps = Psp + Pd = Psp + (exp(vscale N) - 1) / scale
In addition, Pd is bound to the interval [0, 0.5]. The parameter vscale describes
how the overall velocity of near-bottom flow influences the exponential relation"tl 0.5
Q
+-'
C
Q.)
0.4
E
.-t=
:::::l
"0.3
()
Q.)
"- 0 0.2
>.
:t:::
is 0.1
co
.0
0
"0.0
(L
0
high
intermediate
5
10
Local density of tubes N
linear
model
low
Fig. 5.4.1. Relationship between local tube density, N, and probability of recruitment, Pd, in a
gnd cell of the model for three different flow velocities (vscale = 0.1, 0.3, and 1.0). The
straight lines describes the linear model of Heuers et al. (1998).
5 Spatial and Temporal Distribution Patterns
larvae of L. c()l1chilega are attached to the tubes of adults and build their first tube.
Sooner or later the juvenile L. cOflchilega then leaves the adult's tube and plants its
own tube into the sediment. How far the juveniles move from their initial site of
settlement is unknown; in the model, we assume a maximum distance of 5 cm.
Thus, to calculate recruitment in a certain cell, a neighbourhood of 5 cm on either
side has to be taken into account.
Now, the calculation of Pd depends on assumptions of how local tube density
determines local recruitment. The most simple approach would be to assume a
linear relationship between Pd and N, which has been tested in the model (Heuers
et a!. 1998). With this assumption, it was not possible to reproduce two empirical
findings simultaneously: the emergence of patches with low or high density of
L. c()nchilega and the short time span which is needed to establish these densities.
The model thus suggests that simply the amount of hard substrate provided by the
adult's tubes is not sufficient to explain the spatial and temporal distribution of
L. conchilega observed in the field.
Therefore, a relationship between Pd and N is assumed which in phenomenological terms takes into account the effect of local tube density on near-bottom
flow. It must be emphasized that flow is not modelled explicitly, i.e. a hydrodynamical model is not used. The following assumption is used:
Ps = Psp + Pd = Psp + (exp(vscale N) - 1) / scale
In addition, Pd is bound to the interval [0, 0.5]. The parameter vscale describes
how the overall velocity of near-bottom flow influences the exponential relation"tl 0.5
Q
+-'
C
Q.)
0.4
E
.-t=
:::::l
"0.3
()
Q.)
"- 0 0.2
>.
:t:::
is 0.1
co
.0
0
"0.0
(L
0
high
intermediate
5
10
Local density of tubes N
linear
model
low
Fig. 5.4.1. Relationship between local tube density, N, and probability of recruitment, Pd, in a
gnd cell of the model for three different flow velocities (vscale = 0.1, 0.3, and 1.0). The
straight lines describes the linear model of Heuers et al. (1998).