

275
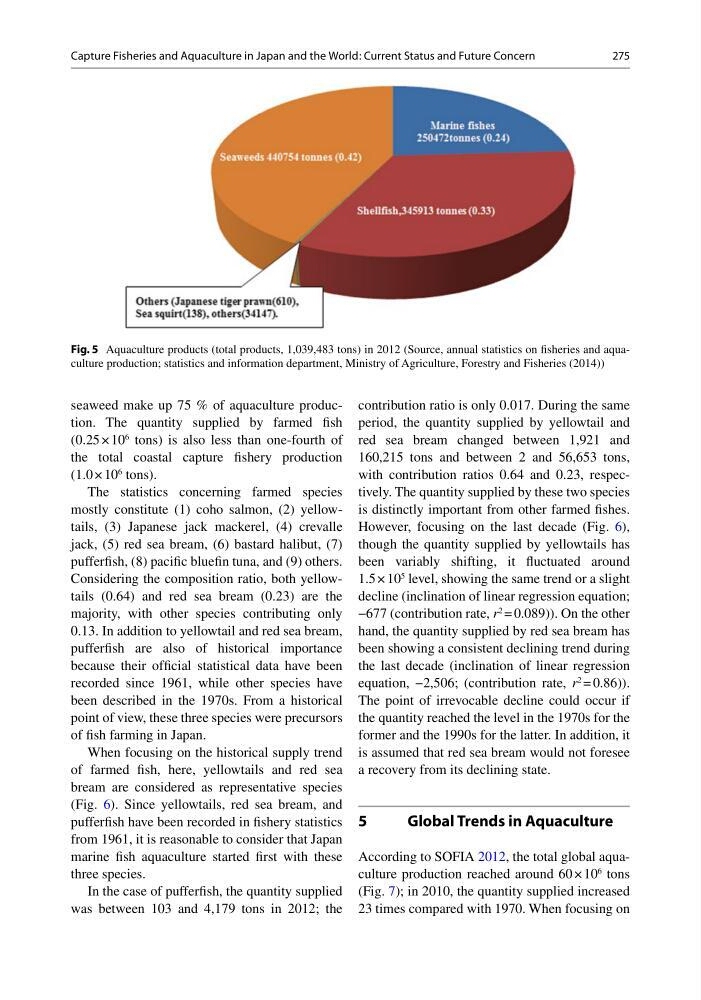
seaweed make up 75 % of aquaculture production. The quantity supplied by farmed fish
(0.25 × 10
6
tons) is also less than one-fourth of
the total coastal capture fishery production
(1.0 × 10
6
tons).
The statistics concerning farmed species
mostly constitute (1) coho salmon, (2) yellowtails, (3) Japanese jack mackerel, (4) crevalle
jack, (5) red sea bream, (6) bastard halibut, (7)
pufferfish, (8) pacific bluefin tuna, and (9) others.
Considering the composition ratio, both yellowtails (0.64) and red sea bream (0.23) are the
majority, with other species contributing only
0.13. In addition to yellowtail and red sea bream,
pufferfish are also of historical importance
because their official statistical data have been
recorded since 1961, while other species have
been described in the 1970s. From a historical
point of view, these three species were precursors
of fish farming in Japan.
When focusing on the historical supply trend
of farmed fish, here, yellowtails and red sea
bream are considered as representative species
(Fig. 6). Since yellowtails, red sea bream, and
pufferfish have been recorded in fishery statistics
from 1961, it is reasonable to consider that Japan
marine fish aquaculture started first with these
three species.
In the case of pufferfish, the quantity supplied
was between 103 and 4,179 tons in 2012; the
contribution ratio is only 0.017. During the same
period, the quantity supplied by yellowtail and
red sea bream changed between 1,921 and
160,215 tons and between 2 and 56,653 tons,
with contribution ratios 0.64 and 0.23, respectively. The quantity supplied by these two species
is distinctly important from other farmed fishes.
However, focusing on the last decade (Fig. 6),
though the quantity supplied by yellowtails has
been variably shifting, it fluctuated around
1.5 × 10
5
level, showing the same trend or a slight
decline (inclination of linear regression equation;
−677 (contribution rate, r
2
= 0.089)). On the other
hand, the quantity supplied by red sea bream has
been showing a consistent declining trend during
the last decade (inclination of linear regression
equation, −2,506; (contribution rate, r
2
= 0.86)).
The point of irrevocable decline could occur if
the quantity reached the level in the 1970s for the
former and the 1990s for the latter. In addition, it
is assumed that red sea bream would not foresee
a recovery from its declining state.
5
Global Trends in Aquaculture
According to SOFIA 2012, the total global aquaculture production reached around 60 × 10
6
tons
(Fig. 7); in 2010, the quantity supplied increased
23 times compared with 1970. When focusing on
Fig. 5 Aquaculture products (total products, 1,039,483 tons) in 2012 (Source, annual statistics on fisheries and aquaculture production; statistics and information department, Ministry of Agriculture, Forestry and Fisheries (2014))
Capture Fisheries and Aquaculture in Japan and the World: Current Status and Future Concern
seaweed make up 75 % of aquaculture production. The quantity supplied by farmed fish
(0.25 × 10
6
tons) is also less than one-fourth of
the total coastal capture fishery production
(1.0 × 10
6
tons).
The statistics concerning farmed species
mostly constitute (1) coho salmon, (2) yellowtails, (3) Japanese jack mackerel, (4) crevalle
jack, (5) red sea bream, (6) bastard halibut, (7)
pufferfish, (8) pacific bluefin tuna, and (9) others.
Considering the composition ratio, both yellowtails (0.64) and red sea bream (0.23) are the
majority, with other species contributing only
0.13. In addition to yellowtail and red sea bream,
pufferfish are also of historical importance
because their official statistical data have been
recorded since 1961, while other species have
been described in the 1970s. From a historical
point of view, these three species were precursors
of fish farming in Japan.
When focusing on the historical supply trend
of farmed fish, here, yellowtails and red sea
bream are considered as representative species
(Fig. 6). Since yellowtails, red sea bream, and
pufferfish have been recorded in fishery statistics
from 1961, it is reasonable to consider that Japan
marine fish aquaculture started first with these
three species.
In the case of pufferfish, the quantity supplied
was between 103 and 4,179 tons in 2012; the
contribution ratio is only 0.017. During the same
period, the quantity supplied by yellowtail and
red sea bream changed between 1,921 and
160,215 tons and between 2 and 56,653 tons,
with contribution ratios 0.64 and 0.23, respectively. The quantity supplied by these two species
is distinctly important from other farmed fishes.
However, focusing on the last decade (Fig. 6),
though the quantity supplied by yellowtails has
been variably shifting, it fluctuated around
1.5 × 10
5
level, showing the same trend or a slight
decline (inclination of linear regression equation;
−677 (contribution rate, r
2
= 0.089)). On the other
hand, the quantity supplied by red sea bream has
been showing a consistent declining trend during
the last decade (inclination of linear regression
equation, −2,506; (contribution rate, r
2
= 0.86)).
The point of irrevocable decline could occur if
the quantity reached the level in the 1970s for the
former and the 1990s for the latter. In addition, it
is assumed that red sea bream would not foresee
a recovery from its declining state.
5
Global Trends in Aquaculture
According to SOFIA 2012, the total global aquaculture production reached around 60 × 10
6
tons
(Fig. 7); in 2010, the quantity supplied increased
23 times compared with 1970. When focusing on
Fig. 5 Aquaculture products (total products, 1,039,483 tons) in 2012 (Source, annual statistics on fisheries and aquaculture production; statistics and information department, Ministry of Agriculture, Forestry and Fisheries (2014))
Capture Fisheries and Aquaculture in Japan and the World: Current Status and Future Concern