

274
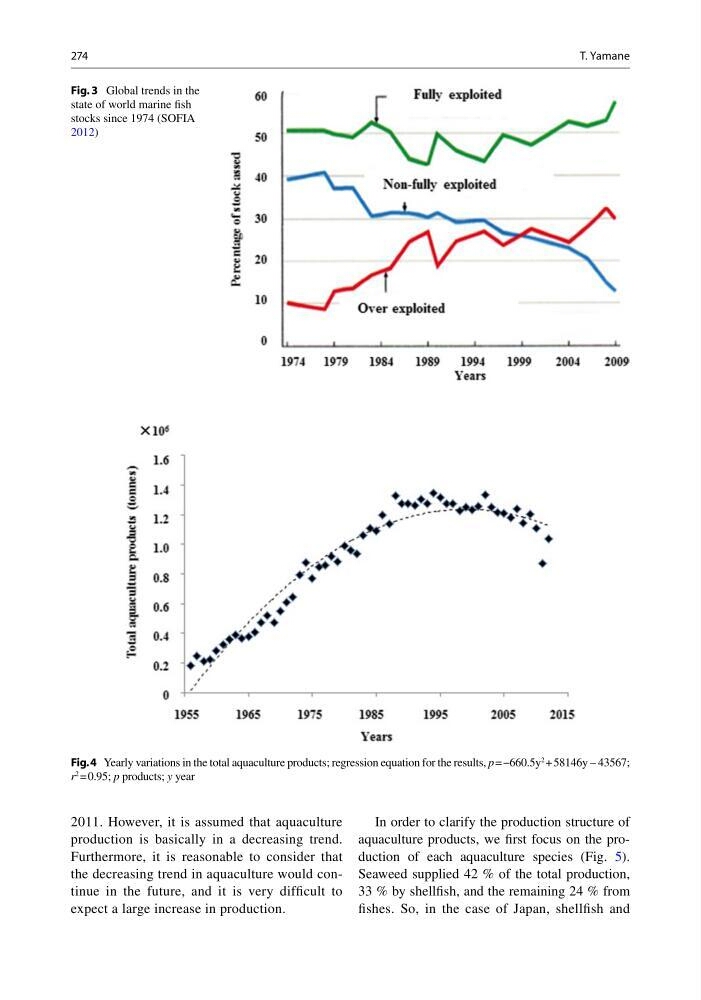
2011. However, it is assumed that aquaculture
production is basically in a decreasing trend.
Furthermore, it is reasonable to consider that
the decreasing trend in aquaculture would continue in the future, and it is very difficult to
expect a large increase in production.
In order to clarify the production structure of
aquaculture products, we first focus on the production of each aquaculture species (Fig. 5).
Seaweed supplied 42 % of the total production,
33 % by shellfish, and the remaining 24 % from
fishes. So, in the case of Japan, shellfish and
Fig. 3 Global trends in the
state of world marine fish
stocks since 1974 (SOFIA
2012)
Fig. 4 Yearly variations in the total aquaculture products; regression equation for the results, p = −660.5y
2 + 58146y – 43567;
r
2 = 0.95; p products; y year
T. Yamane
2011. However, it is assumed that aquaculture
production is basically in a decreasing trend.
Furthermore, it is reasonable to consider that
the decreasing trend in aquaculture would continue in the future, and it is very difficult to
expect a large increase in production.
In order to clarify the production structure of
aquaculture products, we first focus on the production of each aquaculture species (Fig. 5).
Seaweed supplied 42 % of the total production,
33 % by shellfish, and the remaining 24 % from
fishes. So, in the case of Japan, shellfish and
Fig. 3 Global trends in the
state of world marine fish
stocks since 1974 (SOFIA
2012)
Fig. 4 Yearly variations in the total aquaculture products; regression equation for the results, p = −660.5y
2 + 58146y – 43567;
r
2 = 0.95; p products; y year
T. Yamane