

273
On the other hand, according to a recent assessment of global trends in the state of world marine
fish stocks since 1974, the mass of all fish standing stocks has been fully exploited (Fig. 3) in the
FAO statistical areas (16 areas in the ocean).
The result of the assessment based on the
available regional data and information for the
statistical areas indicated that nearly 60 % of fish
standing stocks were already fully exploited, and
over 30 % were overly exploited; non-fully
exploited stocks were no more than about 10 %
since the last half of the 1990s. The biomass of
all fish standing stocks has been decreasing continuously, and since then, the mass of non-fully
exploited stock showed a steep decline.
4
Japan and Global Trends
in the State of Aquaculture
According to the Statistics and Information
Department, Ministry of Agriculture, Forestry
and Fisheries (2014), in Japan, recent aquaculture production indicates a gradual decreasing
trend (Fig. 4). Production rapidly dropped to
0.87 × 10
6
tons in 2011, regaining a little in 2012
at 1.0 × 10
6
tons level. This drop was caused by
the lack of fishery statistical data in the Tohoku
region of Japan.
Aquaculture products reached a peak in
2002 (1.3 × 10
6
tons); since then, it has been
fluctuating at 1.0 × 10
6
tons level except for
x 10 4
1400
1200
1000
800
600
400
200
0
A
B
C
D
E
197 9 198 1 198 3 198 5 198 7 198 9 199 1 199 3 199 4 199 5
Years
199 7 199 9 200 1 200 3 200 5 200 7 200 9 201 1
Cat
ch
(ton
nes
)
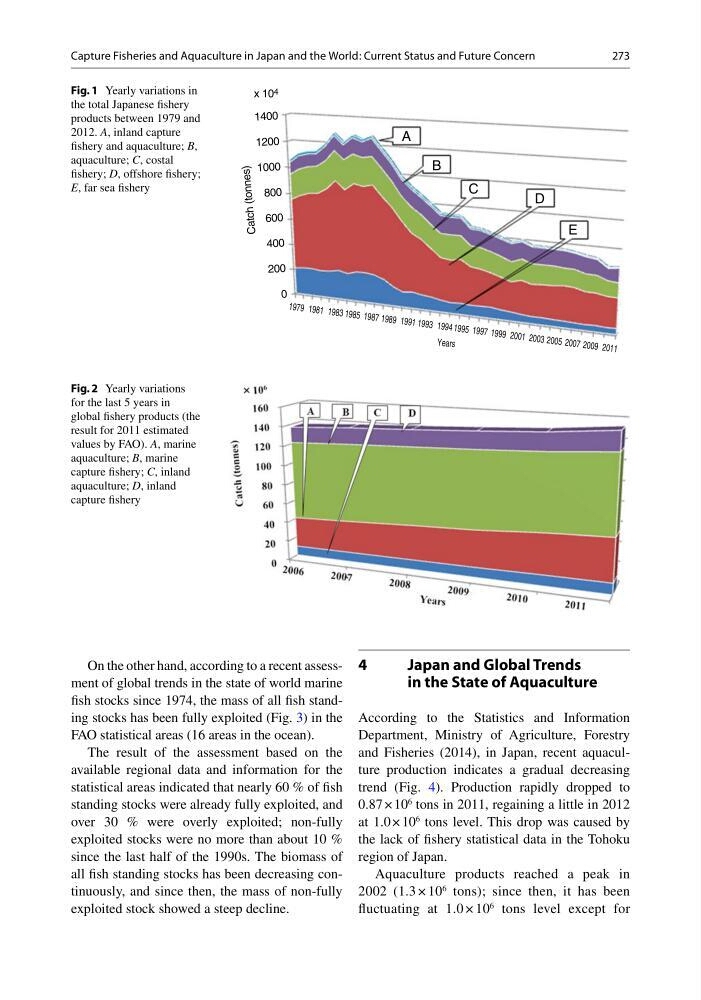
Fig. 1 Yearly variations in
the total Japanese fishery
products between 1979 and
2012. A, inland capture
fishery and aquaculture; B,
aquaculture; C, costal
fishery; D, offshore fishery;
E, far sea fishery
Fig. 2 Yearly variations
for the last 5 years in
global fishery products (the
result for 2011 estimated
values by FAO). A, marine
aquaculture; B, marine
capture fishery; C, inland
aquaculture; D, inland
capture fishery
Capture Fisheries and Aquaculture in Japan and the World: Current Status and Future Concern
On the other hand, according to a recent assessment of global trends in the state of world marine
fish stocks since 1974, the mass of all fish standing stocks has been fully exploited (Fig. 3) in the
FAO statistical areas (16 areas in the ocean).
The result of the assessment based on the
available regional data and information for the
statistical areas indicated that nearly 60 % of fish
standing stocks were already fully exploited, and
over 30 % were overly exploited; non-fully
exploited stocks were no more than about 10 %
since the last half of the 1990s. The biomass of
all fish standing stocks has been decreasing continuously, and since then, the mass of non-fully
exploited stock showed a steep decline.
4
Japan and Global Trends
in the State of Aquaculture
According to the Statistics and Information
Department, Ministry of Agriculture, Forestry
and Fisheries (2014), in Japan, recent aquaculture production indicates a gradual decreasing
trend (Fig. 4). Production rapidly dropped to
0.87 × 10
6
tons in 2011, regaining a little in 2012
at 1.0 × 10
6
tons level. This drop was caused by
the lack of fishery statistical data in the Tohoku
region of Japan.
Aquaculture products reached a peak in
2002 (1.3 × 10
6
tons); since then, it has been
fluctuating at 1.0 × 10
6
tons level except for
x 10 4
1400
1200
1000
800
600
400
200
0
A
B
C
D
E
197 9 198 1 198 3 198 5 198 7 198 9 199 1 199 3 199 4 199 5
Years
199 7 199 9 200 1 200 3 200 5 200 7 200 9 201 1
Cat
ch
(ton
nes
)
Fig. 1 Yearly variations in
the total Japanese fishery
products between 1979 and
2012. A, inland capture
fishery and aquaculture; B,
aquaculture; C, costal
fishery; D, offshore fishery;
E, far sea fishery
Fig. 2 Yearly variations
for the last 5 years in
global fishery products (the
result for 2011 estimated
values by FAO). A, marine
aquaculture; B, marine
capture fishery; C, inland
aquaculture; D, inland
capture fishery
Capture Fisheries and Aquaculture in Japan and the World: Current Status and Future Concern