

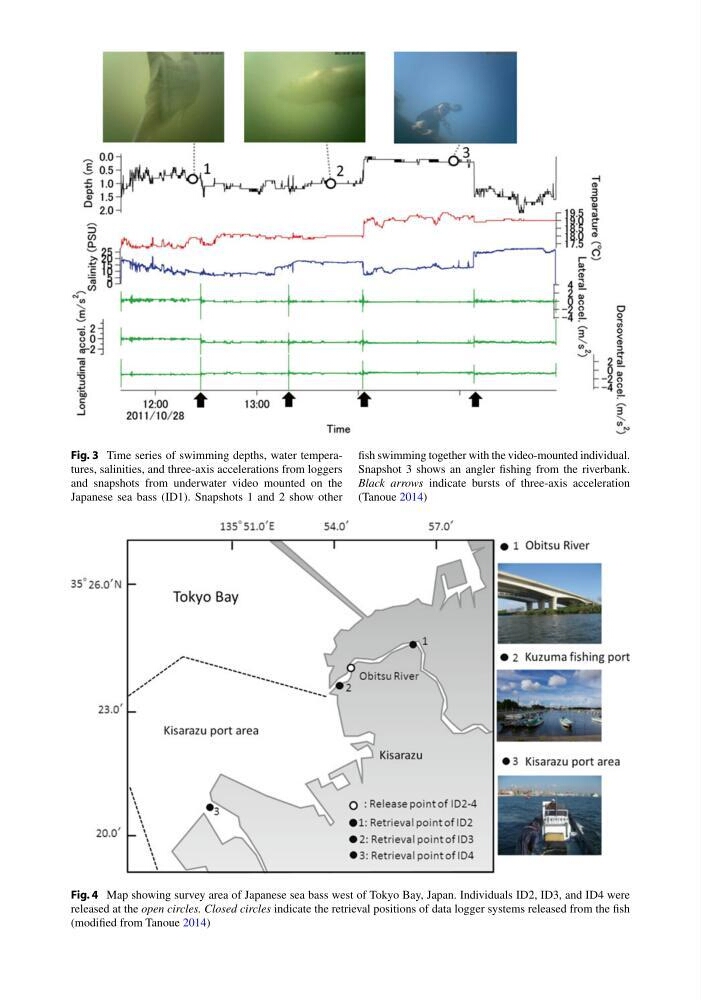
Fig. 3 Time series of swimming depths, water temperatures, salinities, and three-axis accelerations from loggers
and snapshots from underwater video mounted on the
Japanese sea bass (ID1). Snapshots 1 and 2 show other
fi sh swimming together with the video-mounted individual.
Snapshot 3 shows an angler fi shing from the riverbank.
Black arrows indicate bursts of three-axis acceleration
(Tanoue 2014 )
Fig. 4 Map showing survey area of Japanese sea bass west of Tokyo Bay, Japan. Individuals ID2, ID3, and ID4 were
released at the open circles. Closed circles indicate the retrieval positions of data logger systems released from the fi sh
(modifi ed from Tanoue 2014 )
and snapshots from underwater video mounted on the
Japanese sea bass (ID1). Snapshots 1 and 2 show other
fi sh swimming together with the video-mounted individual.
Snapshot 3 shows an angler fi shing from the riverbank.
Black arrows indicate bursts of three-axis acceleration
(Tanoue 2014 )
Fig. 4 Map showing survey area of Japanese sea bass west of Tokyo Bay, Japan. Individuals ID2, ID3, and ID4 were
released at the open circles. Closed circles indicate the retrieval positions of data logger systems released from the fi sh
(modifi ed from Tanoue 2014 )