

246
this, we measured vertical salinity profi les at the
river mouth (6 m in depth), 500 m upstream (4 m
in depth), and 1 km upstream (3 m in depth). We
averaged salinity values from the river surface to
1 m depth (surface layer) and from the river bottom to 1 m above (bottom layer).
3
Results
3.1
Salinity Conditions
The salinities in the surface and bottom layers
were respectively 19.1 psu and 30.8 psu at the
river mouth, 6.5 psu and 28.7 psu 500 m upstream,
and 1.9 psu and 5.0 psu 1 km upstream of the
river mouth, showing a clear decrease in salinity
upstream. The difference in salinity between the
surface layer and bottom layer was greatest at
the river mouth and lowest 1 km upstream of the
river mouth due to freshwater and shallow
bottom depths upstream. Seawater intruded into
the bottom layer 500 m upstream of the river
mouth, but was much lower 1 km upstream.
3.2
Tracking Survey
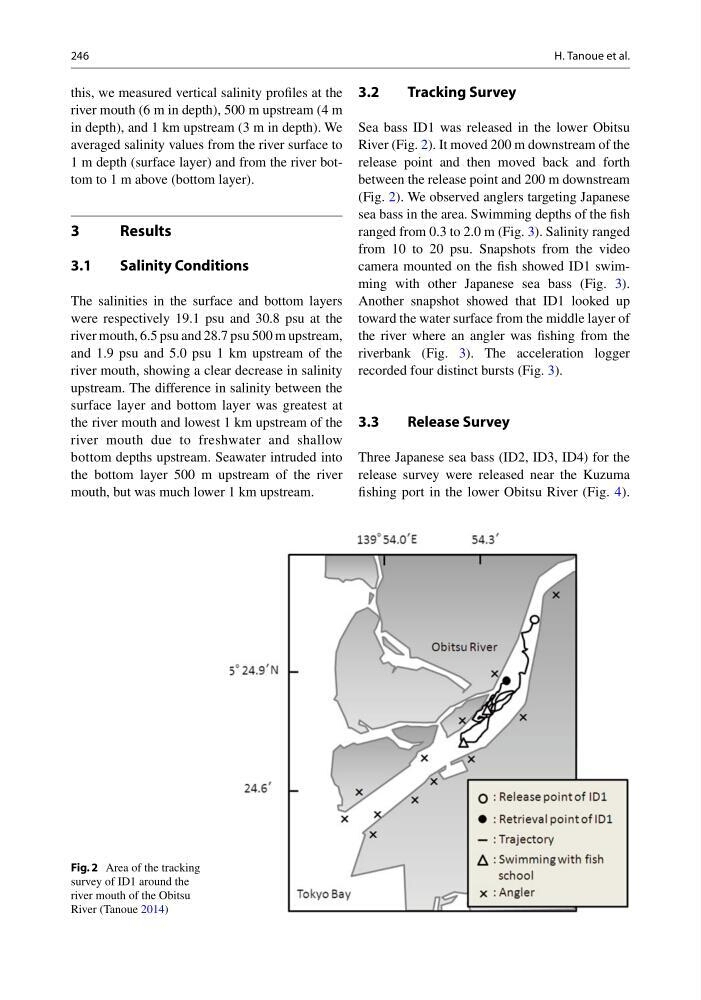
Sea bass ID1 was released in the lower Obitsu
River (Fig. 2 ). It moved 200 m downstream of the
release point and then moved back and forth
between the release point and 200 m downstream
(Fig. 2 ). We observed anglers targeting Japanese
sea bass in the area. Swimming depths of the fi sh
ranged from 0.3 to 2.0 m (Fig. 3 ). Salinity ranged
from 10 to 20 psu. Snapshots from the video
camera mounted on the fi sh showed ID1 swimming with other Japanese sea bass (Fig. 3 ).
Another snapshot showed that ID1 looked up
toward the water surface from the middle layer of
the river where an angler was fi shing from the
riverbank (Fig. 3 ). The acceleration logger
recorded four distinct bursts (Fig. 3 ).
3.3
Release Survey
Three Japanese sea bass (ID2, ID3, ID4) for the
release survey were released near the Kuzuma
fi shing port in the lower Obitsu River (Fig. 4 ).
Fig. 2 Area of the tracking
survey of ID1 around the
river mouth of the Obitsu
River (Tanoue 2014 )
H. Tanoue et al.
this, we measured vertical salinity profi les at the
river mouth (6 m in depth), 500 m upstream (4 m
in depth), and 1 km upstream (3 m in depth). We
averaged salinity values from the river surface to
1 m depth (surface layer) and from the river bottom to 1 m above (bottom layer).
3
Results
3.1
Salinity Conditions
The salinities in the surface and bottom layers
were respectively 19.1 psu and 30.8 psu at the
river mouth, 6.5 psu and 28.7 psu 500 m upstream,
and 1.9 psu and 5.0 psu 1 km upstream of the
river mouth, showing a clear decrease in salinity
upstream. The difference in salinity between the
surface layer and bottom layer was greatest at
the river mouth and lowest 1 km upstream of the
river mouth due to freshwater and shallow
bottom depths upstream. Seawater intruded into
the bottom layer 500 m upstream of the river
mouth, but was much lower 1 km upstream.
3.2
Tracking Survey
Sea bass ID1 was released in the lower Obitsu
River (Fig. 2 ). It moved 200 m downstream of the
release point and then moved back and forth
between the release point and 200 m downstream
(Fig. 2 ). We observed anglers targeting Japanese
sea bass in the area. Swimming depths of the fi sh
ranged from 0.3 to 2.0 m (Fig. 3 ). Salinity ranged
from 10 to 20 psu. Snapshots from the video
camera mounted on the fi sh showed ID1 swimming with other Japanese sea bass (Fig. 3 ).
Another snapshot showed that ID1 looked up
toward the water surface from the middle layer of
the river where an angler was fi shing from the
riverbank (Fig. 3 ). The acceleration logger
recorded four distinct bursts (Fig. 3 ).
3.3
Release Survey
Three Japanese sea bass (ID2, ID3, ID4) for the
release survey were released near the Kuzuma
fi shing port in the lower Obitsu River (Fig. 4 ).
Fig. 2 Area of the tracking
survey of ID1 around the
river mouth of the Obitsu
River (Tanoue 2014 )
H. Tanoue et al.