

238
The fi ve ecological status classes of the EBQI are
(Personnic et al. 2014 ): bad (EBQI < 3.5), poor
(3.5 ≥ EBQI < 4.5), moderate (4.5 ≥ EBQI < 6),
good (6.0 ≥ EBQI < 7.5) and high (EBQI ≥ 7.5)
(Table 1 ).
3
A Strongly Contrasting
Response Compared
with that of Species-Based
Indices
A number of species-based biotic indices
(Ecological Quality Ratios, EQRs), based upon
P. oceanica alone, or upon P. oceanica and leaf
epibiota, have been proposed, e.g. PREI, POMI
and PiBo (Romero et al. 2007 ; Gobert et al. 2009 ;
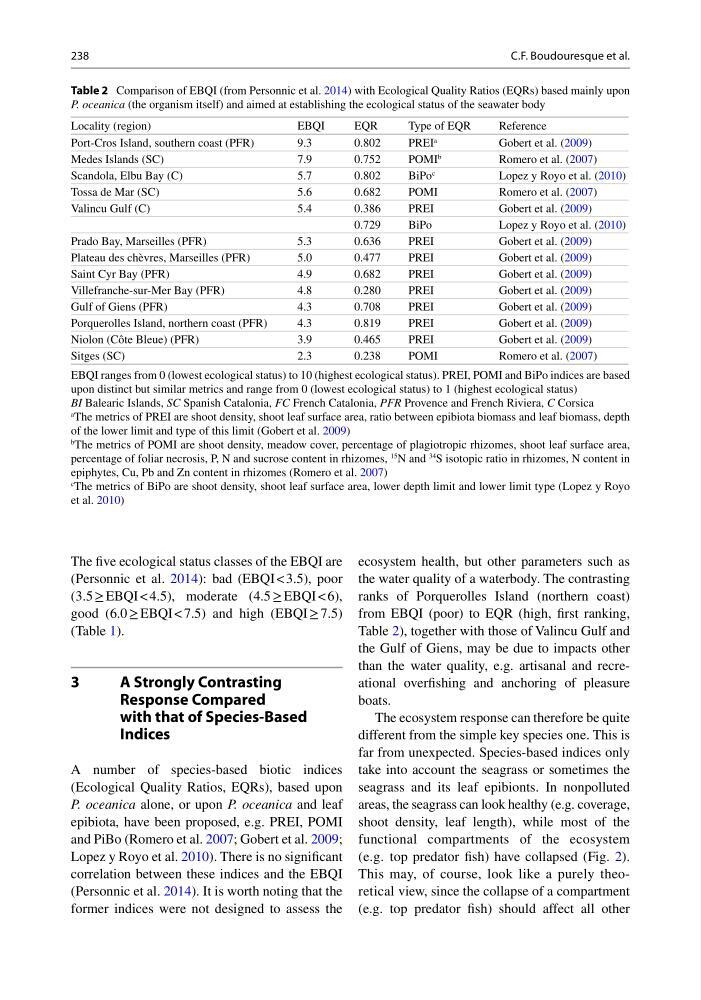
Lopez y Royo et al. 2010 ). There is no signifi cant
correlation between these indices and the EBQI
(Personnic et al. 2014 ). It is worth noting that the
former indices were not designed to assess the
ecosystem health, but other parameters such as
the water quality of a waterbody. The contrasting
ranks of Porquerolles Island (northern coast)
from EBQI (poor) to EQR (high, fi rst ranking,
Table 2 ), together with those of Valincu Gulf and
the Gulf of Giens, may be due to impacts other
than the water quality, e.g. artisanal and recreational overfi shing and anchoring of pleasure
boats.
The ecosystem response can therefore be quite
different from the simple key species one. This is
far from unexpected. Species-based indices only
take into account the seagrass or sometimes the
seagrass and its leaf epibionts. In nonpolluted
areas, the seagrass can look healthy (e.g. coverage,
shoot density, leaf length), while most of the
functional compartments of the ecosystem
(e.g. top predator fi sh) have collapsed (Fig. 2 ).
This may, of course, look like a purely theoretical view, since the collapse of a compartment
(e.g. top predator fi sh) should affect all other
Table 2 Comparison of EBQI (from Personnic et al. 2014 ) with Ecological Quality Ratios (EQRs) based mainly upon
P. oceanica (the organism itself) and aimed at establishing the ecological status of the seawater body
Locality (region)
EBQI
EQR
Type of EQR
Reference
Port-Cros Island, southern coast (PFR)
9.3
0.802
PREI
a
Gobert et al. ( 2009 )
Medes Islands (SC)
7.9
0.752
POMI
b
Romero et al. ( 2007 )
Scandola, Elbu Bay (C)
5.7
0.802
BiPo
c
Lopez y Royo et al. ( 2010 )
Tossa de Mar (SC)
5.6
0.682
POMI
Romero et al. ( 2007 )
Valincu Gulf (C)
5.4
0.386
PREI
Gobert et al. ( 2009 )
0.729
BiPo
Lopez y Royo et al. ( 2010 )
Prado Bay, Marseilles (PFR)
5.3
0.636
PREI
Gobert et al. ( 2009 )
Plateau des chèvres, Marseilles (PFR)
5.0
0.477
PREI
Gobert et al. ( 2009 )
Saint Cyr Bay (PFR)
4.9
0.682
PREI
Gobert et al. ( 2009 )
Villefranche-sur-Mer Bay (PFR)
4.8
0.280
PREI
Gobert et al. ( 2009 )
Gulf of Giens (PFR)
4.3
0.708
PREI
Gobert et al. ( 2009 )
Porquerolles Island, northern coast (PFR)
4.3
0.819
PREI
Gobert et al. ( 2009 )
Niolon (Côte Bleue) (PFR)
3.9
0.465
PREI
Gobert et al. ( 2009 )
Sitges (SC)
2.3
0.238
POMI
Romero et al. ( 2007 )
EBQI ranges from 0 (lowest ecological status) to 10 (highest ecological status). PREI, POMI and BiPo indices are based
upon distinct but similar metrics and range from 0 (lowest ecological status) to 1 (highest ecological status)
BI Balearic Islands, SC Spanish Catalonia, FC French Catalonia, PFR Provence and French Riviera, C Corsica
a
The metrics of PREI are shoot density, shoot leaf surface area, ratio between epibiota biomass and leaf biomass, depth
of the lower limit and type of this limit (Gobert et al. 2009 )
b
The metrics of POMI are shoot density, meadow cover, percentage of plagiotropic rhizomes, shoot leaf surface area,
percentage of foliar necrosis, P, N and sucrose content in rhizomes,
15 N and
34
S isotopic ratio in rhizomes, N content in
epiphytes, Cu, Pb and Zn content in rhizomes (Romero et al. 2007 )
c
The metrics of BiPo are shoot density, shoot leaf surface area, lower depth limit and lower limit type (Lopez y Royo
et al. 2010 )
C.F. Boudouresque et al.
The fi ve ecological status classes of the EBQI are
(Personnic et al. 2014 ): bad (EBQI < 3.5), poor
(3.5 ≥ EBQI < 4.5), moderate (4.5 ≥ EBQI < 6),
good (6.0 ≥ EBQI < 7.5) and high (EBQI ≥ 7.5)
(Table 1 ).
3
A Strongly Contrasting
Response Compared
with that of Species-Based
Indices
A number of species-based biotic indices
(Ecological Quality Ratios, EQRs), based upon
P. oceanica alone, or upon P. oceanica and leaf
epibiota, have been proposed, e.g. PREI, POMI
and PiBo (Romero et al. 2007 ; Gobert et al. 2009 ;
Lopez y Royo et al. 2010 ). There is no signifi cant
correlation between these indices and the EBQI
(Personnic et al. 2014 ). It is worth noting that the
former indices were not designed to assess the
ecosystem health, but other parameters such as
the water quality of a waterbody. The contrasting
ranks of Porquerolles Island (northern coast)
from EBQI (poor) to EQR (high, fi rst ranking,
Table 2 ), together with those of Valincu Gulf and
the Gulf of Giens, may be due to impacts other
than the water quality, e.g. artisanal and recreational overfi shing and anchoring of pleasure
boats.
The ecosystem response can therefore be quite
different from the simple key species one. This is
far from unexpected. Species-based indices only
take into account the seagrass or sometimes the
seagrass and its leaf epibionts. In nonpolluted
areas, the seagrass can look healthy (e.g. coverage,
shoot density, leaf length), while most of the
functional compartments of the ecosystem
(e.g. top predator fi sh) have collapsed (Fig. 2 ).
This may, of course, look like a purely theoretical view, since the collapse of a compartment
(e.g. top predator fi sh) should affect all other
Table 2 Comparison of EBQI (from Personnic et al. 2014 ) with Ecological Quality Ratios (EQRs) based mainly upon
P. oceanica (the organism itself) and aimed at establishing the ecological status of the seawater body
Locality (region)
EBQI
EQR
Type of EQR
Reference
Port-Cros Island, southern coast (PFR)
9.3
0.802
PREI
a
Gobert et al. ( 2009 )
Medes Islands (SC)
7.9
0.752
POMI
b
Romero et al. ( 2007 )
Scandola, Elbu Bay (C)
5.7
0.802
BiPo
c
Lopez y Royo et al. ( 2010 )
Tossa de Mar (SC)
5.6
0.682
POMI
Romero et al. ( 2007 )
Valincu Gulf (C)
5.4
0.386
PREI
Gobert et al. ( 2009 )
0.729
BiPo
Lopez y Royo et al. ( 2010 )
Prado Bay, Marseilles (PFR)
5.3
0.636
PREI
Gobert et al. ( 2009 )
Plateau des chèvres, Marseilles (PFR)
5.0
0.477
PREI
Gobert et al. ( 2009 )
Saint Cyr Bay (PFR)
4.9
0.682
PREI
Gobert et al. ( 2009 )
Villefranche-sur-Mer Bay (PFR)
4.8
0.280
PREI
Gobert et al. ( 2009 )
Gulf of Giens (PFR)
4.3
0.708
PREI
Gobert et al. ( 2009 )
Porquerolles Island, northern coast (PFR)
4.3
0.819
PREI
Gobert et al. ( 2009 )
Niolon (Côte Bleue) (PFR)
3.9
0.465
PREI
Gobert et al. ( 2009 )
Sitges (SC)
2.3
0.238
POMI
Romero et al. ( 2007 )
EBQI ranges from 0 (lowest ecological status) to 10 (highest ecological status). PREI, POMI and BiPo indices are based
upon distinct but similar metrics and range from 0 (lowest ecological status) to 1 (highest ecological status)
BI Balearic Islands, SC Spanish Catalonia, FC French Catalonia, PFR Provence and French Riviera, C Corsica
a
The metrics of PREI are shoot density, shoot leaf surface area, ratio between epibiota biomass and leaf biomass, depth
of the lower limit and type of this limit (Gobert et al. 2009 )
b
The metrics of POMI are shoot density, meadow cover, percentage of plagiotropic rhizomes, shoot leaf surface area,
percentage of foliar necrosis, P, N and sucrose content in rhizomes,
15 N and
34
S isotopic ratio in rhizomes, N content in
epiphytes, Cu, Pb and Zn content in rhizomes (Romero et al. 2007 )
c
The metrics of BiPo are shoot density, shoot leaf surface area, lower depth limit and lower limit type (Lopez y Royo
et al. 2010 )
C.F. Boudouresque et al.